Ibuprofen

courtesy.....http://www.magritek.com/

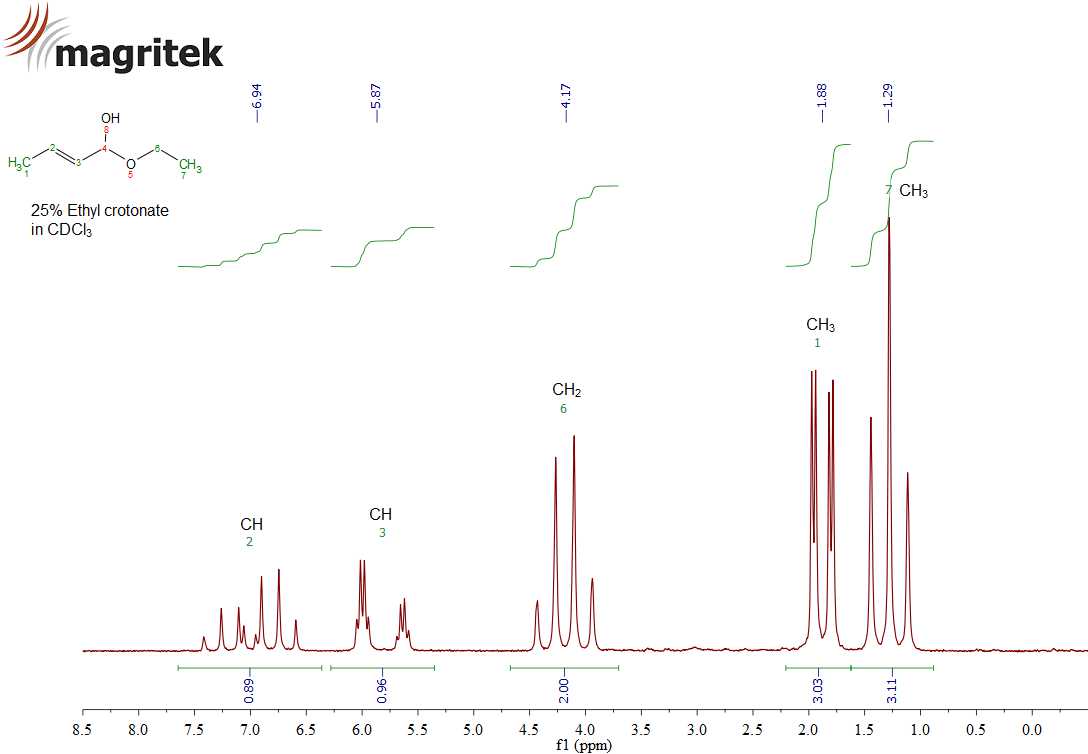
1H spectrum
The simplified 2-dimensional molecular structure of the common NSAID (non-steroidal anti-inflammatory drug) Ibuprofen is shown below, along with the 1-Dimensional proton (1H) NMR spectrum of this compound. They hydrogen atoms are colored, to correspond with the peaks in the NMR spectrum.


The protons that are different (chemically speaking) have different NMR frequencies because the chemical environment causes the local magnetic field for that nucleus to be unique. The "PPM" axis is used to report frequency differences that are scaled by the magnetic field strength. This allows the peak positions to be compared for spectra acquired at various magnetic field strengths, without having to do any conversions. Zero, on this PPM axis, is the frequency position (orchemical shift) of a compound called Tetramethyl Silane or TMS.
The NMR signals from the various chemically unique protons appear not as single peaks, but as multiplets of peaks. This is because the spins of the hydrogen nuclei bonded to neighboring carbon atoms perturb the energy of the NMR signals. This effect is often called "J-coupling," "spin-spin splitting," or "scalar coupling." For example, the CH hydrogen (shown in green) is affected by six equivalent CH3 (red) hydrogen nuclei, and two equivalent (dark blue) CH2 hydrogens. Because there are eight hydrogen atoms on the neighboring carbon atoms, the NMR signal from the (green) CH is split into 9 different individual peaks (or a nonet). This follows the so-called "n+1" rule, which is over-simplified, but often taught to beginning students learning NMR spectroscopy. The (purple) CH that is adjacent to the (cyan) CH3 group appears as 4 peaks (or a quartet) because of the 3 hydrogens on the neighboring carbon. Click on each peak above to see an expanded view of the NMR signal.


 Two-dimensional 600 MHz
1H–1H COSY NMR spectrum and molecular structure of the non-steroidal anti-inflammatory drug ibuprofen dissolved in DMSO-d6.
.................. ...........
The simplified 2-dimensional molecular structure of the common NSAID (non-steroidal anti-inflammatory drug) Ibuprofen is shown below, along with the 1-Dimensional proton (1H) NMR spectrum of this compound. They hydrogen atoms are colored, to correspond with the peaks in the NMR spectrum.
The protons that are different (chemically speaking) have different NMR frequencies because the chemical environment causes the local magnetic field for that nucleus to be unique. The "PPM" axis is used to report frequency differences that are scaled by the magnetic field strength. This allows the peak positions to be compared for spectra acquired at various magnetic field strengths, without having to do any conversions. Zero, on this PPM axis, is the frequency position (orchemical shift) of a compound called Tetramethyl Silane or TMS.
The NMR signals from the various chemically unique protons appear not as single peaks, but as multiplets of peaks. This is because the spins of the hydrogen nuclei bonded to neighboring carbon atoms perturb the energy of the NMR signals. This effect is often called "J-coupling," "spin-spin splitting," or "scalar coupling." For example, the CH hydrogen (shown in green) is affected by six equivalent CH3 (red) hydrogen nuclei, and two equivalent (dark blue) CH2 hydrogens. Because there are eight hydrogen atoms on the neighboring carbon atoms, the NMR signal from the (green) CH is split into 9 different individual peaks (or a nonet). This follows the so-called "n+1" rule, which is over-simplified, but often taught to beginning students learning NMR spectroscopy. The (purple) CH that is adjacent to the (cyan) CH3 group appears as 4 peaks (or a quartet) because of the 3 hydrogens on the neighboring carbon. Click on each peak above to see an expanded view of the NMR signal.
Above is an NMR Spectrum of Ibuprofen measured by Spinsolve. Below is a 2D COSY of the same sample taken in just 8 minutes. No special NMR knowledge was required, a single click was required by the operator.
13 C NMR
125 MHz 13C NMR spectrum with broadband 1H decoupling and molecular structure of the non-steroidal anti-inflammatory drug ibuprofen dissolved in DMSO-d6.
MASS
IR
See how the 2D COSY enables the small coupling peaks of the proton at position 10 to become apparent, even though they are hidden in the 1D proton spectrum. This shows how the power of 2D COSY NMR is particularly important for benchtop NMR spectrometers.
1H–1H COSY NMR spectrum and molecular structure of the non-steroidal anti-inflammatory drug ibuprofen dissolved in DMSO-d6.

1H COSY

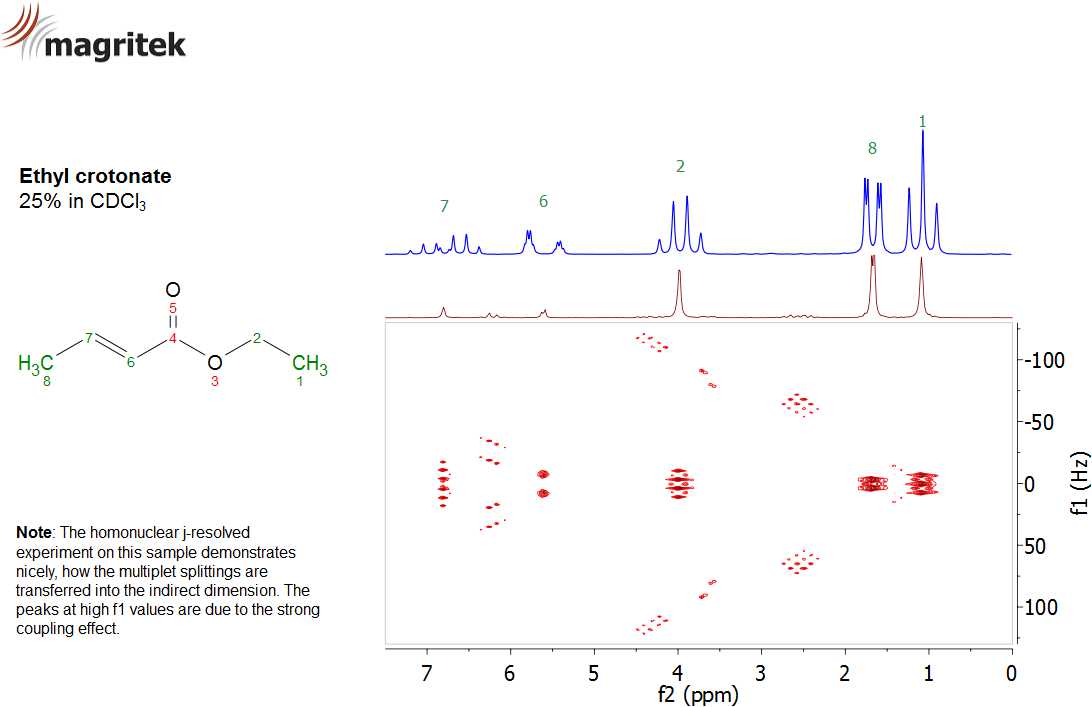
1H homonuclear j-resolved 2D spectrum

T1 analysis

T2 analysis

13C spectrum

13C-1H HETCOR

1H-13C HSQC

1H-13C HMQC

1H-13C HMBC