DR ANTHONY MELVIN CRASTO,WorldDrugTracker, helping millions, A 90 % paralysed man in action for you, I am suffering from transverse mylitis and bound to a wheel chair, With death on the horizon, nothing will not stop me except God................DR ANTHONY MELVIN CRASTO Ph.D ( ICT, Mumbai) , INDIA 25Yrs Exp. in the feld of Organic Chemistry,Working for GLENMARK GENERICS at Navi Mumbai, INDIA. Serving chemists around the world. Helping them with websites on Chemistry.Million hits on google, world acclamation from industry, academia, drug authorities for websites, blogs and educational contribution

Tuesday 31 October 2017

2,4-Diphenyl-2,3-dihydro-1,5-benzothiazepine

str1
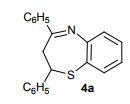
2,4-Diphenyl-2,3-dihydro-1,5-benzothiazepine (4a) 1,3-Diphenyl-2-propen-1-one (1a).
Yellow solid; mp 114-116 C [lit.1 , 114-115 °C], AcOEt/PE 1:9.
1H NMR (300 MHz, CDCl3,): 3.07 (t, J = 12.6 Hz, 1 H), 3.32 (dd, J = 4.7, 13.1 Hz, 1 H), 4.99 (dd, J = 4.5, 12.0 Hz, 1 H), 7.12-7.17 (m, 1 H), 7.25-7.30 (m, 5 H), 7.44-7.51 (m, 4 H), 7.62 (d, J = 6.1 Hz, 2 H), 8.06 (d, J = 7.5 Hz, 2 H).
Isolated Yield: 339 mg, 86%
str2
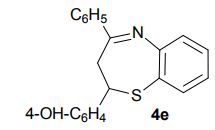
2-(4-Hydroxyphenyl)-4-phenyl-2,3-dihydro-1,5-benzothiazepine (4e) 3-(4-Hydroxyphenyl)-1-phenyl-2-propen-1-one (1e).
Light brown solid; mp 131-134 °C. AcOEt/PE 40:60.
1H NMR (CDCl3, 300 MHz):  = 3.01 (t, J = 12.7 Hz, 1 H), 3.28 (dd, J = 4.8, 12.9 Hz, 1 H), 4.95 (dd, J = 4.7, 12.5 Hz, 1 H), 5.10 (bs, 1 H), 6.76 (d, J = 8.5 Hz, 2 H), 7.18-7.21 (m, 3 H), 7.35 (d, J = 8.5 Hz, 1 H), 7.46- 7.55 (m, 4 H), 7.63 (dd, J =1.5, 7.7 Hz, 1 H), 8.06 (m, 2 H).
13C NMR (CDCl3, 75 MHz): 37.99 (CH2), 60.07 (CH), 115.53 (CH), 123.08 (C), 127.40 (CH), 128.79 (CH), 131.17 (CH), 136.54 (C), 141.59 (C), 155.24 (C). IR (KBr): 1599, 2921, 3350 cm-1 .
MS (ESI): m/z= 332.24 (MH)+ . Anal. Calcd. for C21H17NOS: C, 76.10; H, 5.17; N, 4.23, found: C, 76.21; H, 5.15; N, 4.24. Isolated Yield: 360 mg, 87%


A practical synthesis of 2,3-dihydro-1,5-benzothiazepines

Green Chem., 2017, Accepted Manuscript
DOI: 10.1039/C7GC02097J, Paper
Domenico Carlo Maria Albanese, nicoletta gaggero, Meng Fei
2,3-Dihydro-1,5-benzothiazepines have been obtained through a domino process involving a Michael addition of 2-aminothiophenols to chalcones, followed by in situ cyclization. Up to 98% chemical yields have been obtained at...

A practical synthesis of 2,3-dihydro-1,5-benzothiazepines


Abstract

2,3-Dihydro-1,5-benzothiazepines have been obtained through a domino process involving a Michael addition of 2-aminothiophenols to chalcones, followed by in situ cyclization. Up to 98% chemical yields have been obtained at room temperature under essentially neutral conditions by using hexafluoro-2-propanol as an efficient medium.
/////////////////

Sunday 29 October 2017

Saturday 28 October 2017

(S)-2-(4-Chlorobenzoyl)-1,2,3,4-tetrahydrobenzo[e]pyrazino[1,2-a][1,4]diazepine-6,12(11H,12aH)-dione—Synthesis and Crystallographic Studies

Molbank 2017 m964 sch001


Synthesis of the (S)-2-(4-Chlorobenzoyl)-1,2,3,4-tetrahydrobenzo[e]pyrazino[1,2-a][1,4]diazepine-6,12(11H,12aH)-dione (4)

(S)-piperazine-2-carboxylic acid dihydrochloride (5, 700 mg, 3.45 mmol, 1 equiv.) was dispersed in 50 mL of 1:1 water:dioxane mixture and treated with sodium hydroxide (276 mg, 6.89 mmol, 2 equiv.). After dissolution of the starting material, 4-chlorobenzoyl chloride (6, 0.49 mL, 3.79 mmol, 1.1 equiv.) was added and reaction mixture was stirred in room temperature for 18 h. The next day, the disappearance of starting material and formation of (S)-4-(4-chlorobenzoyl)piperazine-2-carboxylic acid (7) was confirmed by LRMS-ESI spectra. Then, isatoic anhydride (8, 1.69 g, 10.34 mmol, 3 equiv.) was added, followed by addition of sodium carbonate (1.10 g, 10.34 mmol, 3 equiv.); the reaction mixture was heated in 60 °C for 18 h. The following day, formation of the (S)-1-(2-aminobenzoyl)-4-(4-chlorobenzoyl)piperazine-2-carboxylic acid 9 was confirmed by LRMS-ESI spectra. The volatiles were evaporated under reduced pressure, then the residue was co-evaporated with toluene (3 × 50 mL) and dissolved in dry DMF. For cyclization of 9, HATU (3.93 g, 10.34 mmol, 3 equiv.) and DIPEA (1.80 mL, 10.34 mmol, 3 equiv.) were added, and reaction mixture was stirred in room temperature for 18 h. The day after, the volatiles were evaporated under reduced pressure and residue was dissolved in water:ethyl acetate biphasic system. The organic phase was washed with water (2 × 50 mL), 0.5 M HCl (3 × 50 mL), saturated sodium bicarbonate (1 × 50 mL), and dried over magnesium sulphate. The crude product dissolved in ethyl acetate was evaporated with silica gel (2 g) and purified by column chromatography using hexane:ethyl acetate 2:8 v/v mixture, followed by pure ethyl acetate. Yield: 711 mg (56%). 1H-NMR (500 MHz, DMSO-d6): 10.55, 10.45 (2 × s, 2 × NH); 7.80–7.70 (m, 1H, HAr); 7.70–7.40 (m, 5H, HAr); 7.30–7.20 (m, 1H, HAr); 7.20–7.00 (m, 1H, HAr); 4.45–3.30 (m, 7H, 3 × CH2, 1 × CH); 13C-NMR (125 MHz, DMSO-d6): 170.5, 169.5, 166.6, 136.6, 135.0, 134.2, 132.3, 130.9, 129.3, 129.0, 128.5, 128.3, 125.6, 124.0, 120.9, 51.7, 42.7, 42.2, 38.2; HRMS (ESI): m/z [M + H]+ calcd. for C19H17ClN3O3: 370.09530, 372.09235, found: 370.09517, 372.09206; m.p. 248–250 °C.  = +290 (c 1.0, DMSO). IR (KBr): cm−1 3465, 3369, 3229, 3160, 3109, 3068, 2909, 2866, 1694, 1657, 1620, 1521, 1477, 1431, 1407, 1339, 1303, 1262, 1219, 1181, 1162, 1092, 1035, 1010.


Molbank 20172017(4), M964; doi: 10.3390/M964
Communication
(S)-2-(4-Chlorobenzoyl)-1,2,3,4-tetrahydrobenzo[e]pyrazino[1,2-a][1,4]diazepine-6,12(11H,12aH)-dione—Synthesis and Crystallographic Studies
Adam Mieczkowski 1,*, Damian Trzybiński 2, Marcin Wilczek 3, Mateusz Psurski 4Orcid, Maciej Bagiński 1,3, Bartosz Bieszczad 1,3, Magdalena Mroczkowska 1,3 and Krzysztof Woźniak 2
1
Institute of Biochemistry and Biophysics Polish Academy of Sciences, Pawinskiego 5a, 02-106 Warsaw, Poland
2
Biological and Chemical Research Centre, University of Warsaw, Żwirki i Wigury 101, 02-089 Warsaw, Poland
3
Faculty of Chemistry, University of Warsaw, Pasteura 1, 02-093 Warsaw, Poland
4
Institute of Immunology and Experimental Therapy, Polish Academy of Sciences, 12 R. Weigl, 53-114 Wroclaw, Poland
*
Correspondence: Tel.: +48-22-592-35-06; Fax: +48-22-592-21-90
Received: 12 October 2017 / Accepted: 25 October 2017 / Published: 27 October 2017

Abstract

: 
(S)-2-(4-Chlorobenzoyl)-1,2,3,4-tetrahydrobenzo[e]pyrazino[1,2-a][1,4]diazepine-6,12(11H,12aH)-dione was obtained in a three-step, one-pot synthesis, starting from optically pure (S)-2-piperazine carboxylic acid dihydrochloride. Selective acylation of the β-nitrogen atom followed by condensation with isatoic anhydride and cyclization with HATU/DIPEA to a seven-member benzodiazepine ring, led to the tricyclic benzodiazepine derivative. Crystallographic studies and initial biological screening were performed for the title compound.

Keywords:
 (S)-2-piperazinecarboxylic acid; tricyclic benzodiazepines; isatoic anhydride; cytotoxicity

http://www.mdpi.com/1422-8599/2017/4/M964/htm
file:///C:/Users/Inspiron/Downloads/molbank-2017-M964-s002.pdf


/////////

Ethyl-2-butenoate

Abstract

For the last fifty years nuclear magnetic resonance spectroscopy, generally referred as NMR, is one of the most versatile techniques for elucidation of structure of organic compounds. Among all available spectrometric methods, NMR is the only technique which offers a complete analysis and interpretation of the entire spectrum. Due to improved experimental technology and novel approaches, over the last decade nuclear magnetic resonance (NMR) has shown a tremendous progress. Generally, NMR spectroscopy makes use of three approaches; those are one dimension (1D), two dimensions (2D) and three dimensions (3D). Usually, the first approach of 1D-NMR (1H DEPT, 13C, 15N, 19F, 31P, etc.) generates good information about the structure of simple organic compounds, but in case of larger molecules the 1D-NMR spectra are generally overcrowded. Hence, the second approach of 2D-NMR (COSY, DQFCOSY, MQFCOSY, HETCOR, HSQC, HMQC, HMBC, TOCSY, NOESY, EXSY, etc.) is used for the further larger molecules, but 2D-NMR spectra also becomes complex and overlapping when used for further very large molecules like proteins. Hence, so as to achieve high resolution and reduced overlapping in spectra of very large molecules, Multi Dimensional-NMR (Homonuclear and Heteronuclear) are generally used. This paper supports interpretation of structure of different organic compounds by different NMR techniques.


Image result for nmr examples solutions


13C-NMR proton decoupled spectrum of Ethyl-2-butenoate in CDCl3.


DEPT spectrum of Ethyl-2-butenoate.


COSY


https://www.omicsonline.org/structural-elucidation-of-small-organic-molecules-by-1d-2d-and-multi-dimensional-solution-nmr-spectroscopy-2155-9872.S11-001.php?aid=12051&view=mobile
//////////

Structural Elucidation of Small Organic Molecules by 1D, 2D and Multi Dimensional-Solution NMR Spectroscopy

Neeraj Kumar Fuloria* and Shivkanya Fuloria
Anuradha College of Pharmacy, Amravati University, Maharashtra, India
*Corresponding Author:
Dr. Neeraj Kumar Fuloria 
M.Pharm (Pharmaceutical Chemistry)
Head, M.Pharm (Quality Assurance)
Anuradha College of Pharmacy
Chikhli, Buldhana, Maharashtra, India
Tel: 8805680423
E-mail: nfuloria@gmail.com, nfuloria@rediffmail.com
Received date: January 10, 2013; Accepted date: January 30, 2013; Published date: February 07, 2013
Citation: Fuloria NK, Fuloria S (2013) Structural Elucidation of Small Organic Molecules by 1D, 2D and Multi Dimensional-Solution NMR Spectroscopy. J Anal Bioanal Tech S11:001. doi: 10.4172/2155-9872.S11-001
Copyright: © 2013 de Francisco TMG, et al. This is an open-access article distributed under the terms of the Creative Commons Attribution License, which permits unrestricted use, distribution, and reproduction in any medium, provided the original author and source are credited.

13C NMR OF PHENYL PROPIONATE

Image result for nmr examples solutions

The NMR Spectrum of Iodoethane CH3CH2I

Higher frequency
The CH3 protons produce a peak at δ 1.8 but, instead of a single peak, a triplet is produced. This is because the CH3 protons couple with the adjacent two CH2 protons.
The CH2 protons produce a peak at δ 3.2 but, instead of a single peak, a quartet is produced. This is because the CH2 protons couple with the adjacent three CH3protons.
In general, if there are 'n' protons three bonds away from the resonating group, the absorption will be split into a multiplet of n+1 lines.

2-propen-1-ol

Image result for nmr examples solutions

HR-MAS NMR Spectroscopy in Material Science

Schematic of a HR-MAS stator with a magic angle gradient along the rotor spinning axis. 


The gradient 2D 1 H HR-MAS NMR COSY spectrum for the ionic liquid [MBPyrr] + [TFSI] - 


Image result for nmr examples solutions


The 1 H HR-MAS NMR of the ionic liquid [MBPyrr] + TFSI - at 298K as a A) neat liquid and B)


Pictorial representation of the gradient produced along the magic angle of the rotor. B) The decay of two different water signals found in a 1N methanol solution of an AEM membrane with increasing gradient strength. Gradient strength values (G/cm) are shown above the stack plot. 


//////

13C-NMR spectroscopy

The basics of 13C-NMR spectroscopy

The magnetic moment of a 13C nucleus is much weaker than that of a proton, meaning that NMR signals from 13C nuclei are inherently much weaker than proton signals.  This, combined with the low natural abundance of 13C, means that it is much more difficult to observe carbon signals: more sample is required, and often the data from hundreds of scans must be averaged in order to bring the signal-to-noise ratio down to acceptable levels. Unlike 1H-NMR signals, the area under a 13C-NMR signal cannot be used to determine the number of carbons to which it corresponds.  This is because the signals for some types of carbons are inherently weaker than for other types – peaks corresponding to carbonyl carbons, for example, are much smaller than those for methyl or methylene (CH2) peaks. Peak integration is generally not useful in 13C-NMR spectroscopy, except when investigating molecules that have been enriched with 13C isotope (see section 5.6B).
The resonance frequencies of 13C nuclei are lower than those of protons in the same applied field - in a 7.05 Tesla instrument, protons resonate at about 300 MHz, while carbons resonate at about 75 MHz.  This is fortunate, as it allows us to look at 13C signals using a completely separate 'window' of radio frequencies. Just like in 1H-NMR, the standard used in 13C-NMR experiments to define the 0 ppm point is tetramethylsilane (TMS), although of course in 13C-NMR it is the signal from the four equivalent  carbons in TMS that serves as the standard.  Chemical shifts for 13C nuclei in organic molecules are spread out over a much wider range than for protons – up to 200 ppm for 13C compared to 12 ppm for protons  This is also fortunate, because it means that the signal from each carbon in a compound can almost always be seen as a distinct peak, without the overlapping that often plagues 1H-NMR spectra. The chemical shift of a 13C nucleus is influenced by essentially the same factors that influence a proton's chemical shift: bonds to electronegative atoms and diamagnetic anisotropy effects tend to shift signals downfield (higher resonance frequency). In addition, sp2 hybridization results in a large downfield shift.  The 13C-NMR signals for carbonyl carbons are generally the furthest downfield (170-220 ppm), due to both sp2 hybridization and to the double bond to oxygen.

Because of the low natural abundance of 13C nuclei, it is very unlikely to find two 13C atoms near each other in the same molecule, and thus we do not see spin-spin coupling between neighboring carbons in a 13C-NMR spectrum. There is, however, heteronuclear coupling between 13C carbons and the hydrogens to which they are bound.  Carbon-proton coupling constants are very large, on the order of 100 – 250 Hz.  For clarity, chemists generally use a technique called broadband decoupling, which essentially 'turns off'  C-H  coupling, resulting in a spectrum in which all carbon signals are singlets. Below is the proton-decoupled13C-NMR spectrum of ethyl acetate, showing the expected four signals, one for each of the carbons.

image104.png
While broadband decoupling results in a much simpler spectrum, useful information about the presence of neighboring protons is lost. However, another modern NMR technique called DEPT (Distortionless Enhancement by Polarization Transfer) allows us to determine how many hydrogens are bound to each carbon. For example, a DEPT experiment tells us that the signal at 171 ppm in the ethyl acetate spectrum is a quaternary carbon (no hydrogens bound, in this case a carbonyl carbon), that the 61 ppm signal is from a methylene (CH2) carbon, and that the 21 ppm and 14 ppm signals are both methyl (CH3) carbons. The details of the DEPT experiment are beyond the scope of this text, but DEPT information will often be provided along with 13C spectral data in examples and problems.
Below are two more examples of 13C NMR spectra of simple organic molecules, along with DEPT information.
image106.png


Image result for 13C-NMR spectroscopy benzene


Image result for 13C-NMR spectroscopy benzene


image108.png


One of the greatest advantages of 13C-NMR compared to 1H-NMR is the breadth of the spectrum - recall that carbons resonate from 0-220 ppm relative to the TMS standard, as opposed to only 0-12 ppm for protons. Because of this, 13C signals rarely overlap, and we can almost always distinguish separate peaks for each carbon, even in a relatively large compound containing carbons in very similar environments. In the proton spectrum of 1-heptanol, for example, only the signals for the alcohol proton (Ha) and the two protons on the adjacent carbon (Hb) are easily analyzed.  The other proton signals overlap, making analysis difficult. 
image110.png
In the 13C spectrum of the same molecule, however, we can easily distinguish each carbon signal, and we know from this data that our sample has seven non-equivalent carbons. (Notice also that, as we would expect, the chemical shifts of the carbons get progressively smaller as they get farther away from the deshielding oxygen.)
image112.png
This property of 13C-NMR makes it very helpful in the elucidation of larger, more complex structures.


//////////////////////

Uv spectroscopy

Infrared (IR) spectroscopy

Infrared (IR) spectroscopy

In organic compounds, atoms are said to be bonded to each other through a σ bond when the two bonded atoms are held together by mutual attraction for the shared electron pair that lies between them. The two atoms do not remain static at a fixed distance from one another, however. They are free to vibrate back and forth about an average separation distance known as the average bond length. These movements are termed stretching vibrations. In addition, the bond axis (defined as the line directly joining two bonded atoms) of one bond may rock back and forth within the plane it shares with another bond or bend back and forth outside that plane. These movements are called bending vibrations. Both stretching and bending vibrations represent different energy levels of a molecule. These energy differences match the energies of wavelengths in the infrared region of the electromagnetic spectrum—i.e., those ranging from 2.5 to 15 micrometres (μm; 1 μm = 10−6m). An infrared spectrophotometer is an instrument that passes infrared light through an organic molecule and produces a spectrum that contains a plot of the amount of light transmitted on the vertical axis against the wavelength of infrared radiation on the horizontal axis. In infrared spectra the absorption peaks point downward because the vertical axis is the percent transmittance of the radiation through the sample. Absorption of radiation lowers the percent transmittance value. Since all bonds in an organic molecule interact with infrared radiation, IR spectra provide a great deal of structural data.
The stretching vibrations of strong carbon-hydrogen bonds cause the absorptions around 3.4 μm, with the sharp peak at 3.2 μm due to the hydrogen atom on the carbon-carbon double bond. The many bending vibrations of carbon-hydrogen bonds cause the complicated absorption pattern ranging from about 7 to 25 μm. This area of IR spectra is called the fingerprint region, because the absorption pattern is highly complex but unique to each organic structure. The stretching vibrations for both the carbon-carbon and carbon-oxygen double bonds are easily identified at 6.1 and 5.8 μm, respectively. Most of the functional groups have characteristic IR absorptions similar to those for carbon-oxygen and carbon-carbon double bonds. Infrared spectroscopy is therefore extremely useful for determining the types of functional groups present in organic molecules.

/////////////
https://www.britannica.com/science/chemical-compound/Spectroscopy-of-organic-compounds


WHAT IS AN INFRA-RED SPECTRUM?

This page describes what an infra-red spectrum is and how it arises from bond vibrations within organic molecules.

The background to infra-red spectroscopyHow an infra-red spectrum is produced
You probably know that visible light is made up of a continuous range of different electromagnetic frequencies - each frequency can be seen as a different colour. Infra-red radiation also consists of a continuous range of frequencies - it so happens that our eyes can't detect them.
If you shine a range of infra-red frequencies one at a time through a sample of an organic compound, you find that some frequencies get absorbed by the compound. A detector on the other side of the compound would show that some frequencies pass through the compound with almost no loss, but other frequencies are strongly absorbed.
How much of a particular frequency gets through the compound is measured as percentage transmittance.
A percentage transmittance of 100 would mean that all of that frequency passed straight through the compound without any being absorbed. In practice, that never happens - there is always some small loss, giving a transmittance of perhaps 95% as the best you can achieve.
A transmittance of only 5% would mean that nearly all of that particular frequency is absorbed by the compound. A very high absorption of this sort tells you important things about the bonds in the compound.

What an infra-red spectrum looks like
A graph is produced showing how the percentage transmittance varies with the frequency of the infra-red radiation.


Note:  The infra-red spectra on this page have been produced from graphs taken from the Spectral Data Base System for Organic Compounds (SDBS) at the National Institute of Materials and Chemical Research in Japan.
It is possible that small errors may have been introduced during the process of converting them for use on this site, but these won't affect the argument in any way.


Notice that an unusual measure of frequency is used on the horizontal axis. Wavenumber is defined like this:
Don't worry about this - just accept it!
Similarly, don't worry about the change of scale half-way across the horizontal axis. You will find infra-red spectra where the scale is consistent all the way across, infra-red spectra where the scale changes at around 2000 cm-1, and very occasionally where the scale changes again at around 1000 cm-1.
As you will see when we look at how to interpret infra-red spectra, this doesn't cause any problems - you simply need to be careful reading the horizontal scale.

What causes some frequencies to be absorbed?
Each frequency of light (including infra-red) has a certain energy. If a particular frequency is being absorbed as it passes through the compound being investigated, it must mean that its energy is being transferred to the compound.
Energies in infra-red radiation correspond to the energies involved in bond vibrations.
Bond stretching
In covalent bonds, atoms aren't joined by rigid links - the two atoms are held together because both nuclei are attracted to the same pair of electrons. The two nuclei can vibrate backwards and forwards - towards and away from each other - around an average position.
The diagram shows the stretching that happens in a carbon-oxygen single bond. There will, of course, be other atoms attached to both the carbon and the oxygen. For example, it could be the carbon-oxygen bond in methanol, CH3OH.
The energy involved in this vibration depends on things like the length of the bond and the mass of the atoms at either end. That means that each different bond will vibrate in a different way, involving different amounts of energy.
Bonds are vibrating all the time, but if you shine exactly the right amount of energy on a bond, you can kick it into a higher state of vibration. The amount of energy it needs to do this will vary from bond to bond, and so each different bond will absorb a different frequency (and hence energy) of infra-red radiation.
Bond bending
As well as stretching, bonds can also bend. The diagram shows the bending of the bonds in a water molecule. The effect of this, of course, is that the bond angle between the two hydrogen-oxygen bonds fluctuates slightly around its average value. Imagine a lab model of a water molecule where the atoms are joined together with springs. These bending vibrations are what you would see if you shook the model gently.
Again, bonds will be vibrating like this all the time and, again, if you shine exactly the right amount of energy on the bond, you can kick it into a higher state of vibration. Since the energies involved with the bending will be different for each kind of bond, each different bond will absorb a different frequency of infra-red radiation in order to make this jump from one state to a higher one.

Tying all this together
Look again at the infra-red spectrum of propan-1-ol, CH3CH2CH2OH:
In the diagram, three sample absorptions are picked out to show you the bond vibrations which produced them. Notice that bond stretching and bending produce different troughs in the spectrum.

INTERPRETING AN INFRA-RED SPECTRUM

This page explains how to use an infra-red spectrum to identify the presence of a few simple bonds in organic compounds.


The infra-red spectrum for a simple carboxylic acidEthanoic acid
Ethanoic acid has the structure:
You will see that it contains the following bonds:
carbon-oxygen double, C=O
carbon-oxygen single, C-O
oxygen-hydrogen, O-H
carbon-hydrogen, C-H
carbon-carbon single, C-C
The carbon-carbon bond has absorptions which occur over a wide range of wavenumbers in the fingerprint region - that makes it very difficult to pick out on an infra-red spectrum.
The carbon-oxygen single bond also has an absorbtion in the fingerprint region, varying between 1000 and 1300 cm-1depending on the molecule it is in. You have to be very wary about picking out a particular trough as being due to a C-O bond.


The other bonds in ethanoic acid have easily recognised absorptions outside the fingerprint region.
The C-H bond (where the hydrogen is attached to a carbon which is singly-bonded to everything else) absorbs somewhere in the range from 2853 - 2962 cm-1. Because that bond is present in most organic compounds, that's not terribly useful! What it means is that you can ignore a trough just under 3000 cm-1, because that is probably just due to C-H bonds.
The carbon-oxygen double bond, C=O, is one of the really useful absorptions, found in the range 1680 - 1750 cm-1. Its position varies slightly depending on what sort of compound it is in.
The other really useful bond is the O-H bond. This absorbs differently depending on its environment. It is easily recognised in an acid because it produces a very broad trough in the range 2500 - 3300 


The infra-red spectrum for ethanoic acid looks like this:
The possible absorption due to the C-O single bond is queried because it lies in the fingerprint region. You couldn't be sure that this trough wasn't caused by something else.


The infra-red spectrum for an alcoholEthanol
The O-H bond in an alcohol absorbs at a higher wavenumber than it does in an acid - somewhere between 3230 - 3550 cm-1. In fact this absorption would be at a higher number still if the alcohol isn't hydrogen bonded - for example, in the gas state. All the infra-red spectra on this page are from liquids - so that possibility will never apply.
Notice the absorption due to the C-H bonds just under 3000 cm-1, and also the troughs between 1000 and 1100 cm-1 - one of which will be due to the C-O bond.

The infra-red spectrum for an esterEthyl ethanoate
This time the O-H absorption is missing completely. Don't confuse it with the C-H trough fractionally less than 3000 cm-1. The presence of the C=O double bond is seen at about 1740 cm-1.
The C-O single bond is the absorption at about 1240 cm-1. Whether or not you could pick that out would depend on the detail given by the table of data which you get in your exam, because C-O single bonds vary anywhere between 1000 and 1300 cm-1 depending on what sort of compound they are in. Some tables of data fine it down, so that they will tell you that an absorption from 1230 - 1250 is the C-O bond in an ethanoate.

The infra-red spectrum for a ketonePropanone
You will find that this is very similar to the infra-red spectrum for ethyl ethanoate, an ester. Again, there is no trough due to the O-H bond, and again there is a marked absorption at about 1700 cm-1 due to the C=O.
Confusingly, there are also absorptions which look as if they might be due to C-O single bonds - which, of course, aren't present in propanone. This reinforces the care you have to take in trying to identify any absorptions in the fingerprint region.
Aldehydes will have similar infra-red spectra to ketones.

The infra-red spectrum for a hydroxy-acid2-hydroxypropanoic acid (lactic acid)
This is interesting because it contains two different sorts of O-H bond - the one in the acid and the simple "alcohol" type in the chain attached to the -COOH group.
The O-H bond in the acid group absorbs between 2500 and 3300, the one in the chain between 3230 and 3550 cm-1. Taken together, that gives this immense trough covering the whole range from 2500 to 3550 cm-1. Lost in that trough as well will be absorptions due to the C-H bonds.
Notice also the presence of the strong C=O absorption at about 1730 cm-1.

The infra-red spectrum for a primary amine1-aminobutane
Primary amines contain the -NH2 group, and so have N-H bonds. These absorb somewhere between 3100 and 3500 cm-1. That double trough (typical of primary amines) can be seen clearly on the spectrum to the left of the C-H absorptions.
THE FINGERPRINT REGION OF AN INFRA-RED SPECTRUM

This page explains what the fingerprint region of an infra-red spectrum is, and how it can be used to identify an organic molecule.


What is the fingerprint region
This is a typical infra-red spectrum:


Each trough is caused because energy is being absorbed from that particular frequency of infra-red radiation to excite bonds in the molecule to a higher state of vibration - either stretching or bending.
Some of the troughs are easily used to identify particular bonds in a molecule. For example, the big trough at the left-hand side of the spectrum is used to identify the presence of an oxygen-hydrogen bond in an -OH group.


The region to the right-hand side of the diagram (from about 1500 to 500 cm-1) usually contains a very complicated series of absorptions. These are mainly due to all manner of bending vibrations within the molecule. This is called the fingerprint region.
It is much more difficult to pick out individual bonds in this region than it is in the "cleaner" region at higher wavenumbers. The importance of the fingerprint region is that each different compound produces a different pattern of troughs in this part of the spectrum.

Using the fingerprint region
Compare the infra-red spectra of propan-1-ol and propan-2-ol. Both compounds contain exactly the same bonds. Both compounds have very similar troughs in the area around 3000 cm-1 - but compare them in the fingerprint region between 1500 and 500 cm-1.
The pattern in the fingerprint region is completely different and could therefore be used to identify the compound.
So . . . to positively identify an unknown compound, use its infra-red spectrum to identify what sort of compound it is by looking for specific bond absorptions. That might tell you, for example, that you had an alcohol because it contained an -OH group.
You would then compare the fingerprint region of its infra-red spectrum with known spectra measured under exactly the same conditions to find out which alcohol (or whatever) you had.