

These several pages contain some 1H nmr spectra , with annotations and comments. Try to understand why each spectrum looks as it does, including the approximate chemical shifts and the splitting patterns.


The time has arrived to look at a few H-NMR spectra.....


So far the H-NMR spectra that we have looked at have all had different types of protons that are seen as singlets in the spectra. This is not the normal case.... spectra usually have peaks that appear as groups of peaks due to coupling with neighboring protons, for example, see the spectra of 1,1-dichloroethane shown below.


In this spectrum the two methyls labeled (a) are homotopic, as are the two methylenes labeled (b).
- The three Hs within each methyl are homotopic, and the two Hs within each methylene are enantiotopic.
- Hence we get single absorptions for these groups, displaying the typical ethyl pattern of methyl triplet and CH2 quartet.
- Note the numerical values for the integration shown under the chemical shift scale, which fit the 3 : 2 ratio of CH3 to CH2.
The two CH2 groups labeled (c) are homotopic (enantiotopic within the group) and therefore have the same chemical shift.
- They are split to a triplet by the CH2 at (d).
The two Hs of (d) are enantiotopic and have the same chemical shift.
- With a total of four equivalent neighbors (both (c) groups), (d) should be a quintet. The enlarged view shows this clearly.
- The apparent small additional couplings seen are probably artifacts. The integration values fit the 2 : 1 ratio of (c) to (d).
Part of the use we make of nmr spectra is simple pattern recognition. An ethyl is always triplet + quartet, although the separation between the two groups will vary according to the rest of the structure. A chain of three CH2 with no other neighbors is always triplet + quintet, again with variation in the separation on the chemical shift axis.
The proton NMR spectrum for aminorex and its structural assignments are provided in Fig. 2. Unlike the spectrum of methylaminorex, no upfield (<3 δ) absorbances characteristic of a methyl group occur in the 1H NMR spectrum of the sample.

The obtained spectrum is indicative of the assigned structure of aminorex, with the phenyl group appearing at 7.35 δ, a benzylic methine triplet at 5.46 δ, the exchangeable amino group at 5.2 δ, and the nonequivalent hydrogens of the methylene group β to the phenyl ring at 4.13 and 3.65δ. The
The next spectrum illustrates several spectral features, including the unusual chemical shift of the aromatic hydrogen and an aldehyde H, and another characteristic alkyl splitting pattern.

The homotopic methyls at (a) and the unique H at (b) form an isopropyl (1-methylethyl) group, with an extremely characteristic pattern: doublet + septet, 6 : 1 integration ratio. As is often the case, we must expand the septet region to be able to see all seven peaks; if such an expansion is not available, the absorption may be referred to as a "multiplet", meaning "There's a bunch of lines there, but I can't quite count 'em!"
The pattern of the hydrogens on the benzene ring, (c) and (d), is also typical - typical for a 1,4-disubstituted benzene (para-disubstituted) with groups that differ distinctly, so that the hydrogens next to one substituent are in a significantly different environment than those next to the other. The two widely separated doublets (one neighbor) show clearly in the expansion.
The benzene chemical shift arises from an induced circulation of electrons:

The aldehyde H in R-CHO is usually found shifted downfield to the neighborhood of 9.5 ppm by an induced circulation of the p-electrons of the C=O. In Ar-CHO the additional circulation of the p-electrons of the benzene ring produces a further shift, to the vicinity of 10 ppm.
The next spectrum illustrates accidental equivalence of chemical shift among benzene hydrogens, as well as splitting in another type of alkyl group.

The three groups, (a), (b), and (c) produce spectral features typical of propyl groups. A 3H methyl triplet for (a), split by the neighboring CH2 (b) is straightforward. Likewise, a 2H triplet for (c), also split by (b). The (b) CH2 actually has two differentgroups of neighbors. Nonetheless, because rotation within the alkyl group averages all the coupling constants to the typical alkyl 7.5 - 8 Hz, we see a sextet for (b), as if the CH2 and CH3 neighbors were a single CH5 group. Such behavior is quite common is acyclic structures.
The other feature of note is that although the benzene ring actually bears three different kinds of H (e, f, and g), the CH2substituent on the ring is not electronegative enough to induce a significant chemical shift difference between the hydrogens near it and those further away. Thus the five hydrogens accidentally have the same chemical shift in this spectrometer. An instrument with a more powerful magnet would spread out the spectrum still further, and show us the three expected absorptions.
This example illustrates diastereotopic hydrogens and the construction of a splitting tree to describe coupling to two different hydrogens.

In this spectrum, the diastereotopic alkene hydrogens, labeled Ha and Hb, have distinctly different chemical shifts. Hb is downfield, mixed in among the absorptions for the benzene hydrogens (b), (c), and (d). [Can you draw a resonance structure that explains why Hb is downfield from Ha?] Ha is coupled to both Hb and to the aldehyde H (a), which can be seen as a doublet near 10 ppm.
Since the two hydrogens to which Ha is coupled are different, we must apply the couplings separately in order to predict the observed splitting pattern. This is shown in the sketch below:

The coupling to Hb, trans- across a double bond, is quite large, and splits the Ha absorption into a doublet. Then the smaller coupling to (a) splits each half of the doublet again, giving a quartet. The kind of diagram shown here is called a "splitting tree", and can be constructed for any case in which a group of nuclei is coupled to two distinctly different neighbors.
Let's construct the splitting tree for this one:

Another example of an H NMR is shown below.

Based on the outline given above the four sets of information we get are:
5 basic types of H present in the ratio of 5 : 2 : 2 : 2 : 3.
These are seen as a 5H "singlet" (ArH), two 2H triplets, a 2H quartet and a 3H triplet. Each triplet tells us that there are 2H in the adjacent position, and a quartet tells us that there are 3H adjacent.
(Think of it as the lines you see, L = n + 1, where n = number of equivalent adjacent H)
This tells us we that the peaks at 4.4 and 2.8 ppm must be connected as a CH2CH2 unit.
The peaks at 2.1 and 0.9 ppm as a CH2CH3 unit. Using the chemical shift charts, the H can be assigned to the peaks as below:
4.4ppm (2H) = CH2O;
2.8ppm (2H) = Ar-CH2;
2.1ppm (2H) = O=CCH2CH3 and
0.9ppm (3H) = CH2CH3


| CDCl3 | C6D6 | CD3COCD3 | CD3SOCD3 | CD3C≡N | D2O | ||
|---|---|---|---|---|---|---|---|---|
| (CH3)3C–O–CH3 C–CH3 O–CH3 | 1.19 3.22 | 1.07 3.04 | 1.13 3.13 | 1.11 3.03 | 1.14 3.13 | 1.21 3.22 | ||
| (CH3)3C–O–H C–CH3 O–H | 1.26 1.65 | 1.05 1.55 | 1.18 3.10 | 1.11 4.19 | 1.16 2.18 | --- --- | ||
| C6H5CH3 CH3 C6H5 | 2.36 7.15-7.20 | 2.11 7.00-7.10 | 2.32 7.10-7.20 | 2.30 7.10-7.15 | 2.33 7.15-7.30 | --- --- | ||
| (CH3)2C=O | 2.17 | 1.55 | 2.09 | 2.09 | 2.08 | 2.22 |


The splitting pattern of a given nucleus (or set of equivalent nuclei) can be predicted by the n+1 rule, where n is the number of neighboring spin-coupled nuclei with the same (or very similar) Js. If there are 2 neighboring, spin-coupled, nuclei the observed signal is a triplet ( 2+1=3 ); if there are three spin-coupled neighbors the signal is a quartet ( 3+1=4 ). In all cases the central line(s) of the splitting pattern are stronger than those on the periphery. The intensity ratio of these lines is given by the numbers in Pascal's triangle. Thus a doublet has 1:1 or equal intensities, a triplet has an intensity ratio of 1:2:1, a quartet 1:3:3:1 etc. To see how the numbers in Pascal's triangle are related to the Fibonacci series click on the diagram.
 |  |
|---|---|
| If a given nucleus is spin-coupled to two or more sets of neighboring nuclei by different J values, the n+1 rule does not predict the entire splitting pattern. Instead, the splitting due to one J set is added to that expected from the other J sets. Bear in mind that there may be fortuitous coincidence of some lines if a smaller J is a factor of a larger J. | |
 | |
 < < |
|---|
R-O-H + D2O  R-O-D + D-O-H
R-O-D + D-O-H

Interpreting a H-NMR Spectrum
The NMR Spectrometer at is graded at 300 MHz. This means the Larmor frequency of a single, unaltered hydrogen nucleus and its electron with  , is 300 MHz. The magnetogyric ratio
  of a hydrogen nucleus is 267.513
 . A quick calculation using:
(1) 
shows the magnetic field strength of the NMR is roughly 7.046 T.
Using this information and the  H-NMR spectrum, we can calculate shielding factors for each type of hydrogen nucleus in 3,3-dimethyl-2-butanol, and determine what each spectrum peak actually means.

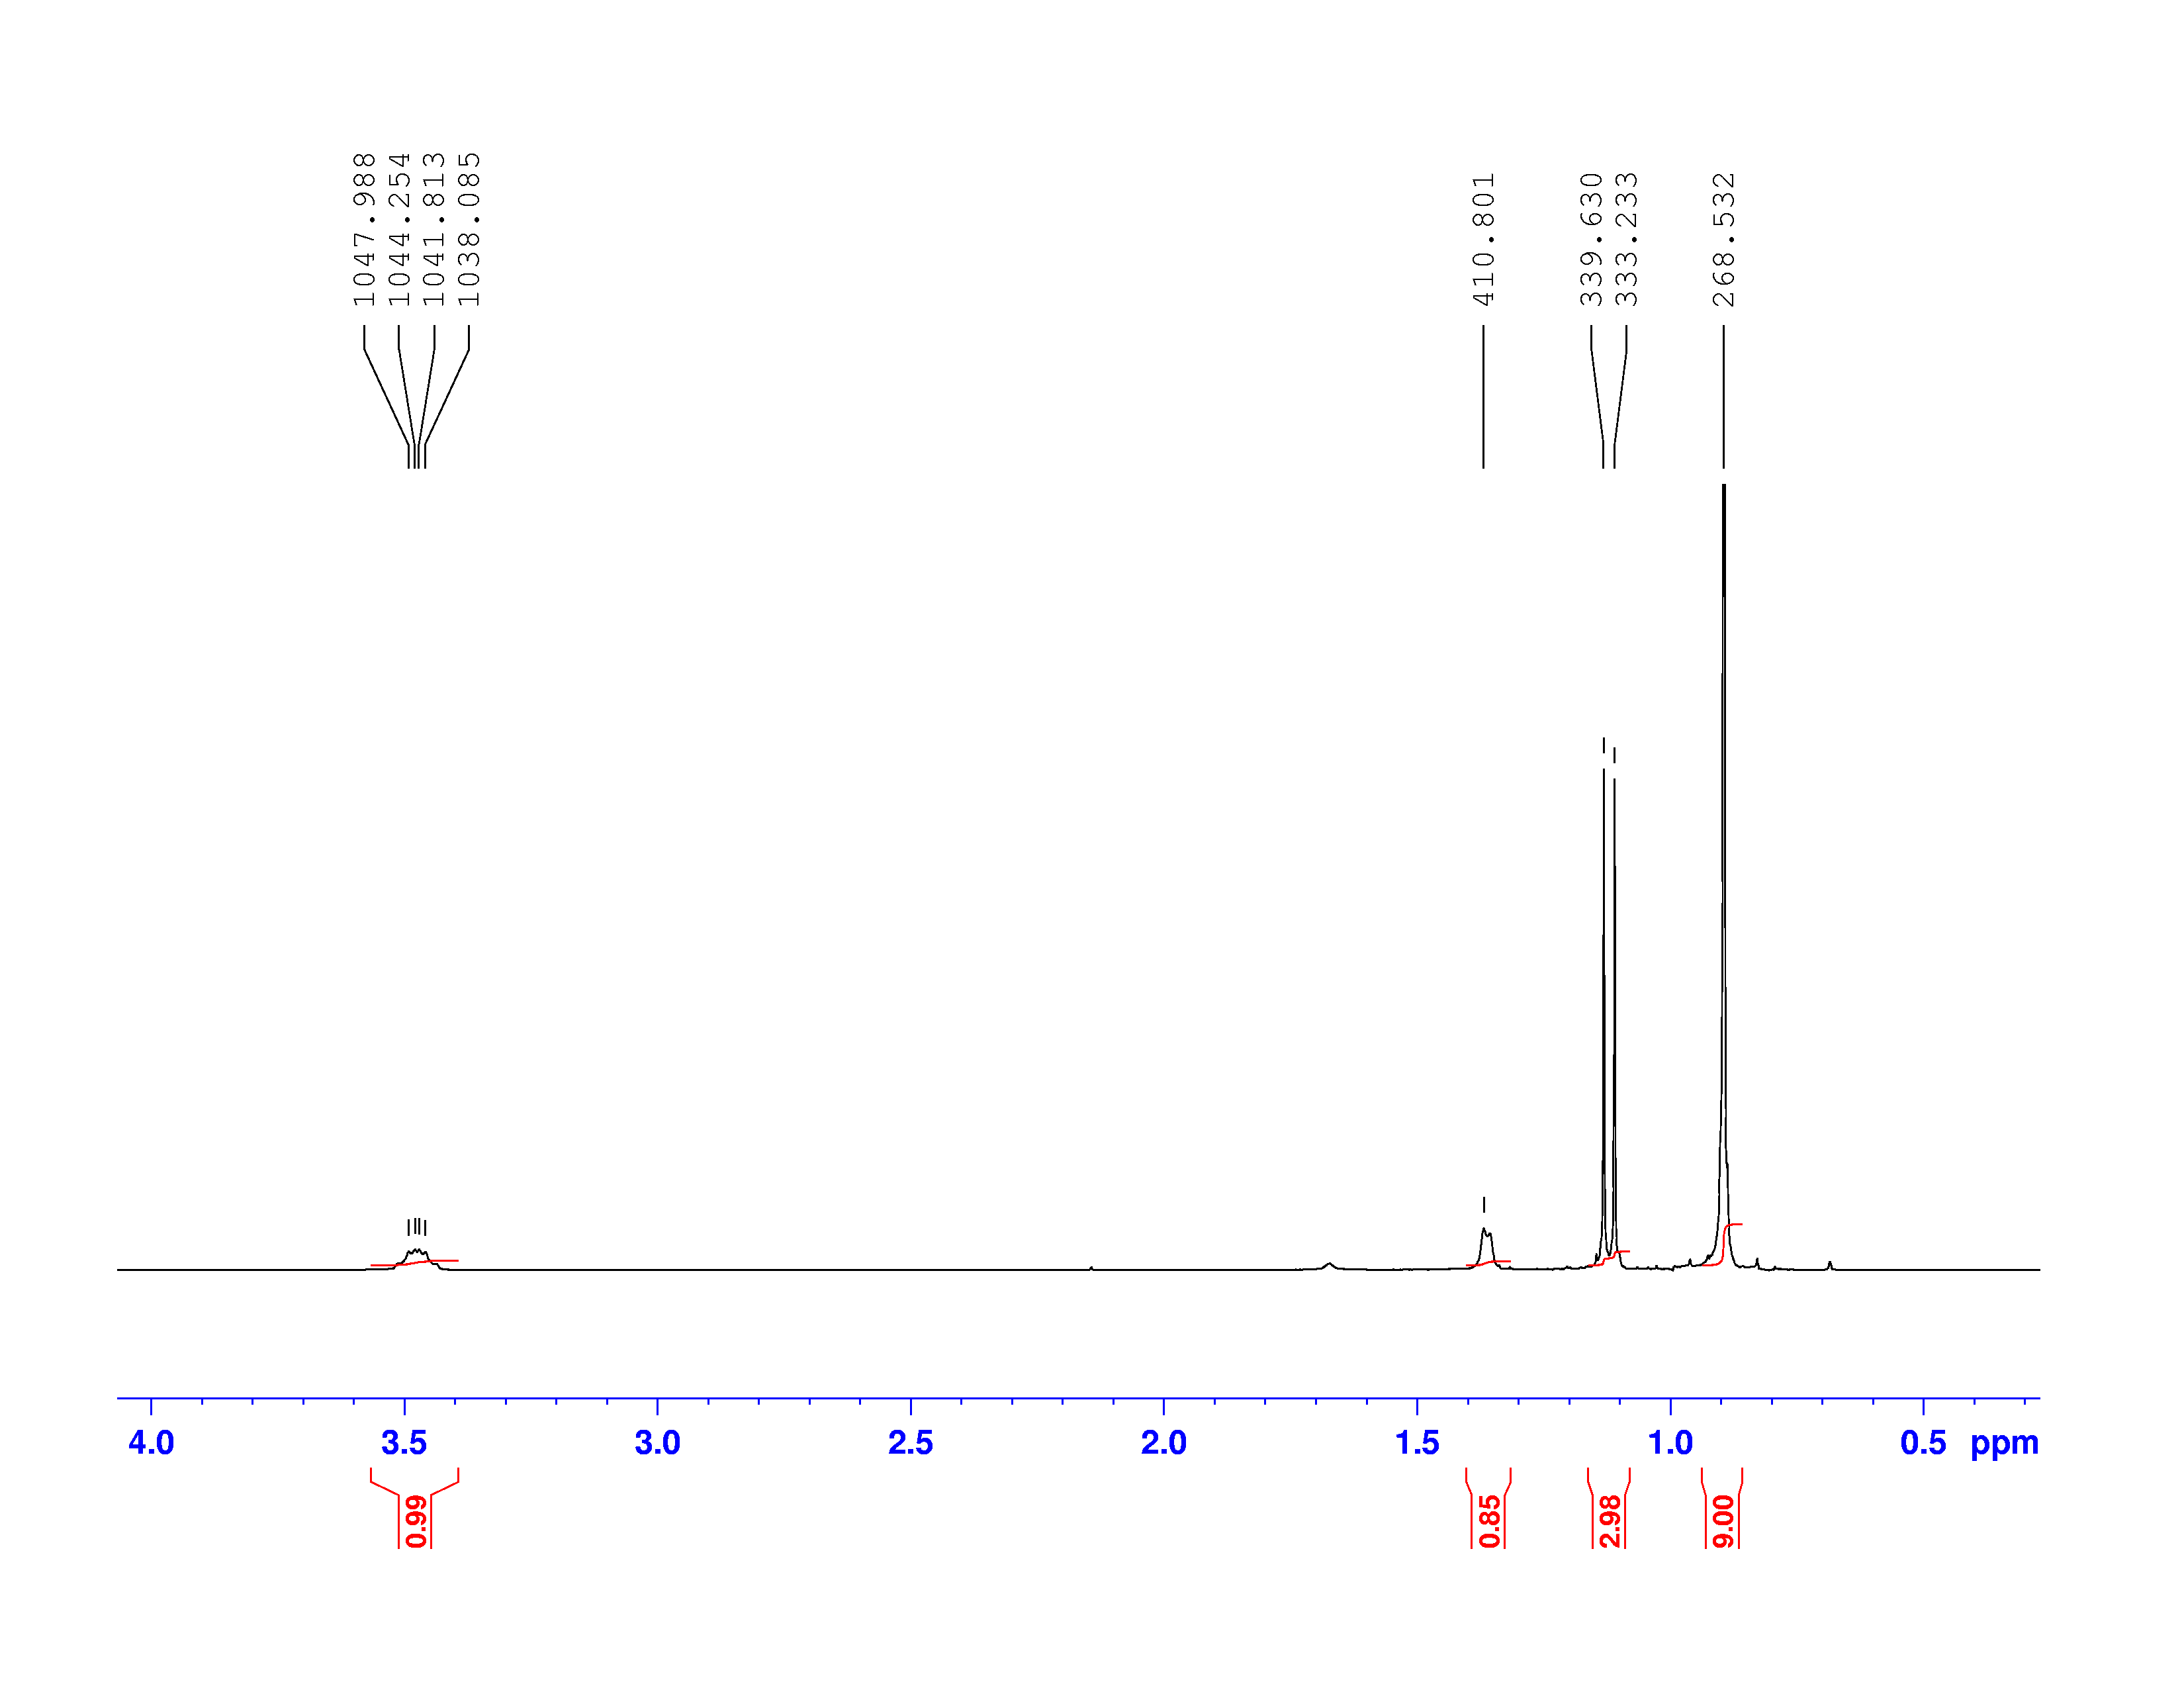
Let’s start with the peak farthest to the right on the spectrum. It is a single peak, called a singlet, that represents nine hydrogens, and is centered at approximately 0.9 ppm on the x-axis. The ppm scale measures how much the Larmor frequency of hydrogen is changed by the effective magnetic field. The Larmor frequency of the hydrogens represented by the first peak was increased by 0.9 ppm of the initial 300 MHz frequency. A calculation of these hydrogens’ shielding factor follows using equation (1):
Shielding factors tend to be small for most hydrogen nuclei. A table of chemical shift and shielding factor values for each hydrogen nucleus in 3,3-dimethyl-2-butanol is below.
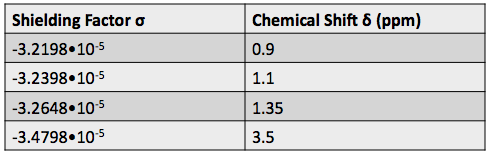
A more negative shielding factor corresponds with a lower electron density around the hydrogen nucleus and with a larger effective magnetic field influencing the nucleus. The presence of very electronegative atoms, like oxygen, near the hydrogen causes increased chemical shifts like the 3.5 ppm shift in the table.
One peak in the spectrum above is split into two peaks centered around the chemical shift 1.1 ppm. This splitting occurs because there is another magnetically active hydrogen nucleus nearby in the molecule. The rule for split peaks is: the number of nearby hydrogens is given by  , where
  is the number of peaks. The definition of “nearby” is usually 1 carbon atom over in the molecule from the one the original hydrogen is attached to.
The figure below shows the structure of 3,3-dimethyl-2-butanol with the hydrogens labeled with their corresponding chemical shifts. This will be the first step in reconstructing the molecule from the NMR data.
