DR ANTHONY MELVIN CRASTO,WorldDrugTracker, helping millions, A 90 % paralysed man in action for you, I am suffering from transverse mylitis and bound to a wheel chair, With death on the horizon, nothing will not stop me except God................DR ANTHONY MELVIN CRASTO Ph.D ( ICT, Mumbai) , INDIA 25Yrs Exp. in the feld of Organic Chemistry,Working for GLENMARK GENERICS at Navi Mumbai, INDIA. Serving chemists around the world. Helping them with websites on Chemistry.Million hits on google, world acclamation from industry, academia, drug authorities for websites, blogs and educational contribution

Wednesday, 23 July 2014

4-METHYL BENZALDEHYDE EXAMPLE IN SPECTROSCOPY

Example 

C8H8O
MW 120

Calculate the degree of unsaturation: the answer is 5. If the degree of unsaturation is 4 or greater, look for an aromatic ring, which has a degree of unsaturation of 4 (3 double bonds plus 1 ring). In addition to an aromatic ring, the molecule can have a carbon-carbon double bond, a carbonyl, or another ring.

IR Spectrum

Look for a carbonyl, since the degree of unsaturation indicates that the compound could have a double bond and we know that the molecule has an oxygen. There is a band at 1703, suggesting an alpha, beta unsaturated aldehyde or ketone(1710-1665). To see if the compound might be an aldehyde, look for bands in the region 2830-2695. In the spectrum below, note the two bands in this region, suggesting that the compound is indeed an aldehyde.

The IR can also help determine whether or not the compound is an aromatic (although the NMR is a better diagnostic method for this). Look for the C–H stretch in aromatics from 3100-3000. Note that compounds that are not aromatic show C-H stretch from 3000-2850.


From the IR alone, we have determined that the molecule probably has aromatic, alkyl, and aldehydic functional groups. Now let's look at the NMR.

Proton NMR Spectrum

Since the IR spectrum indicates an aldehyde, look for this functionality in the NMR spectrum. The aldehydic proton appears in the NMR from 9-10, usually as a small singlet. The singlet of one proton in the spectrum below verifies the presence of an aldehyde:


image of 4-methylbenzaldehyde


Aromatic protons show up from 6.5-8.5 ppm. The four protons in the region 7.3-7.8 ppm indicate four aromatic protons; thus the aromatic ring has two substituents. Benzylic protons - hydrogens on a carbon adjacent to an aromatic ring - show up from 2-3 ppm; the three protons in the singlet peak at 2.4 ppm are likely benzylic protons. Since there are three protons, it is a methyl group.

Therefore we know that the molecule is a di-substituted aromatic ring with a -CHO group and a -CH3 group. Double check that we have the proper number of carbons: 6 (in ring) plus 1 (aldehyde) plus 1 (methyl) equals 8, the number given in the molecular formula.


These hydrogens correspond as follows with the peaks in the NMR:


The molecule is 4-methylbenzaldehyde: a para substituted aromatic. In the organic chemistry teaching laboratory courses, you are not held responsible for proper assignment of ortho-, meta-, or para-substituted rings. However, para substituted rings almost always show a symmetrical pattern in the aromatic region, as in the spectrum above. (See Below

13 C NMR

WATCH OUT FOR INTERPRETATION OF 13 C NMR

Summary and answer

Example  is 4-methylbenzaldehyde:


MORE
IR Spectroscopy
Aromatics show a lot more bands in an IR spectrum than do alkanes, alkenes, and alkynes. The C-C stretching vibrations show up as several bands in the region 1600-1585 and 1500-1400.
One of the most “telling” bands is the presence of a band just to the left of 3000. Alkyl groups show up to the right of 3000, aromatic C–H stretches to the left of 3000.
  • C–H stretch from 3100-3000
  • overtones, weak, from 2000-1665
  • C–C stretch (in-ring) from 1600-1585
  • C–C stretch (in-ring) from 1500-1400
  • C–H “oop” from 900-675

NMR Spectroscopy

Aromatic protons show up from 6.5-8.5 ppm. Benzylic protons are from 2–3 ppm.


Monosubstituted rings will have 5 protons in the region 6.5-8.5 ppm; disubstituted rings will have 4 protons; trisubstituted rings will have 3 protons (and so on). Examples of the NMR of aromatics of mono-, di-, and tri-substituted aromatics are shown below. When interpreting the spectrum of an aromatic compound, remember to count the number of protons in the aromatic region to determine how many times the ring is substituted.


If an aromatic ring has more than one substituent, careful analysis of the shifts and splitting pattern of the protons in the aromatic region reveals the positions on the ring of the different substituents. However, the the shifts depend on the substituents and the splitting is not really first order. Most sophomore-level courses do not cover NMR spectroscopy in the depth required to analyze the aromatic region. Therefore, you will not be able to designate the exact ring substition in many cases.

 In the specific case of disubstituted aromatic rings, para-substituted rings usually show two symmetric sets of peaks that look like doublets. The para-substitution NMR aromatic region pattern usually looks quite different than the patterns for both ortho- and meta-substituted aromatic rings.

Examples of orthometa, and para substitution are illustrated in the NMR spectra of different isomers of chloronitrobenzene, below. The CDCl3 peak is pointed out in each spectrum. (The samples were run using CDCl3as the solvent, and a small contaminant of this deuterated solvent is CHCl3, which shows up at 7.24 ppm. This is used to calibrate the spectrum.) Note the symmetry of the para substituted chloronitro benzene. (Click on each full-size image to view details of the region from 6.5-8.5 ppm.)


click on each NMR spectrum below to see an expanded view of the aromatic region2-chloronitrobenzene
3-chloronitrobenzene
4-chloronitrobenzene


SOME INTERESTING INFO

Trimethyl 2-Hydroxy-2-(2-methoxy-2-oxoethyl)-4-(4-methylphenyl)-6-oxo-1,3,5-cyclohexanetricarboxylate
Edmont V. Stoyanov
Faculty of Pharmacy, Medical University of Sofia, Dunav 2, BG-1000 Sofia, Bulgaria
Tel.: (+359 2) 988 3142; Fax: (+359 2) 987 9874; E-mail: estoyanov@yahoo.com

Aromatic aldehydes react with dimethyl acetonedicarboxylate in molar ratio 1:2 with spontaneous intermolecular Michael addition to give polysubstituted cyclohexanones [1]. We report now the synthesis of an analogous product from 4-methylbenzaldehyde.

To a solution of 4-methylbenzaldehyde (1.20 g, 10 mmol) and dimethyl acetonedicarboxylate (3.48 g, 20 mmol) in 25 ml ethanol, 0.3 ml piperidine was added. The reaction mixture was left to stay at room temperature for 3 days. The separated crystals were filtered off, washed with cold ethanol, recrystallized from dioxane and air-dried. Yield: 3.18 g (71 %). 

Colorless crystals, m. p. 149-150 ºC (dec.) from dioxane.

1H NMR (300 MHz, d6-DMSO): 
2.23 (s, 3H, PhCH3), 2.43 (d, 1H, J=17.0 Hz, HCH), 
2.96 (d, 1H, J=17.0 Hz, HCH), 3.44 (s, 3H, OCH3), 
3.52 (d, 1H, J=12.2 Hz, H-3), 3.56 (s, 3H, OCH3), 
3.60 (s, 3H, OCH3), 3.66 (s, 3H, OCH3), 
3.94 (t, J1=J2=12.2 Hz, H-4), 4.38 (d, 1H, J=12.2 Hz, H-5),
4.67 (s, 1H, H-1), 5.40 (s, 1H, OH), 
7.06 (d, 2H, J=8.0 Hz, 2' and 6'H arom.), 
7.19 (d, 2H, J=8.0 Hz, 3' and 5'H arom.).


13C NMR (75 MHz, d6-DMSO): 
41.4, 42.8, 51.1, 51.5, 51.6, 51.7, 54.3, 61.2, 62.8, 66.3, 74.3, 
128.1 (2xC), 128.9 (2xC), 136.2, 
136.6 (2xC), 167.7, 168.2, 169.5, 169.8.


FT IR (KBr, cm-1): 3511, 2953, 1729, 1516, 1495, 1364.


ESI MS [FIA in MeOH, CH3COONH4/CH3COOK]: 468.2 [M+NH4]+, 489.2 [M+K]+

Reference
1. Haensel, W.; Haller, R. Arch. Pharm. (Weinheim Ger.) 1970303, 334-338.


lahore, pakistan
Map of lahore city .


Image result for lahore pakistan.
.


 Punjabi sweets on a leaf in Lahore Pakistan, 20 Rupees or about 30 cents. I wasn't sure if one is supposed to eat the leaf too but I ate it anyways. 10/07


 New Food Street Lahore


..............
Integration in NMR


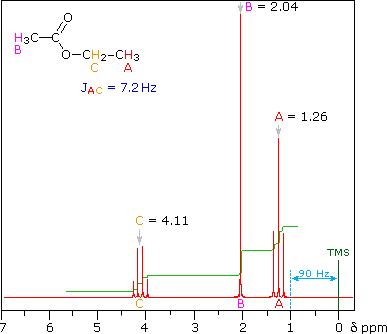
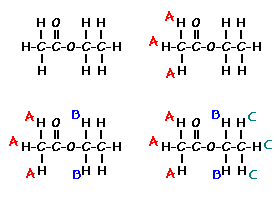
Place your arrow on above structure of Ethyl acetate..................It will flash
see label A,B,C

Integration in NMR


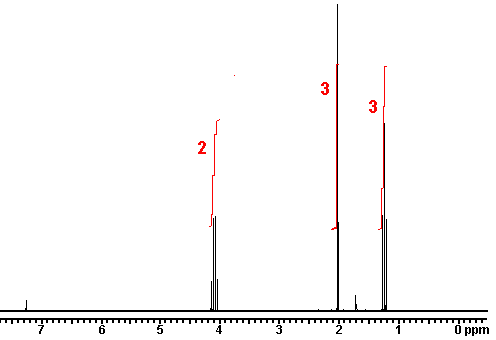
The intensity of the signal is proportional to the number of hydrogens that make the signal. Sometimes, NMR machines display signal intensity as an automatic display above the regular spectrum. (The exact number of hydrogens giving rise to each signal is sometimes also explicitly written above each peak, making our job a lot easier.) The intensity of the signal allows us to conclude that the more hydrogens there are in the same chemical environment, the more intense the signal will be.

Introduction

We can get the following information from a 1H Nuclear Magnetic Resonance (NMR) structure:
  1. The number of signals gives the number of non-equivalent hydrogens
  2. Chemical shifts show differences in the hydrogens’ chemical environments
  3. Splitting presents the number of neighboring hydrogens (N+1 rule)
  4. Integration gives the relative number of hydrogens present at each signal
The integrated intensity of a signal in a 1H NMR spectrum (does not apply to 13C NMR) gives a ratio for the number of hydrogens that give rise to the signal, thereby helping calculate the total number of hydrogens present in a sample.NMR machines can be used to measure signal intensity, a plot of which is sometimes automatically displayed above the regular spectrum. To show these integrations, a recorder pen marks a vertical line with a length that is proportional to the integrated area under a signal (sometimes referred to as a peak)-- a value that is proportional to the number of hydrogens that are accountable for the signal. The pen then moves horizontally until another signal is reached, at which point, another vertical marking is made. We can manually measure the lengths by which the horizontal line is displaced at each peak to attain a ratio of hydrogens from the various signals. We can use this technique to figure out the hydrogen ratio when the number of hydrogens responsible for each signal is not written directly above the peak (look in the links section for an animation on how to manually find the ratio of hydrogens as described here).


Now that we’ve seen how the signal intensity is directly proportionate to the number of hydrogens that give rise to that signal, it makes sense to conclude that the more hydrogens of one kind there are in a molecule (equivalent hydrogens, so in the same chemical environment), the more intense the corresponding NMR signal will be. Here's above  a model that may help clear up some of the uncertainties. 


Problems

1.) True or False? The number of hydrogens determines the intensity of a signal.

ans............False. The relative number of hydrogens determines the intensity of a signal. The signal given by the three hydrogens in CH3CH2CHCl2 will not have the same intensity as the three hydrogens in ClCH2OCH3.
2.) Give the number of signals, the chemical shift value for each signal, and the number of integrating hydrogens for   CH3OCH2CH2OCH3
answer There are 2 signals. One is at 3.3 ppm (6 hydrogens); the other at 3.5 ppm (4 hydrogens).
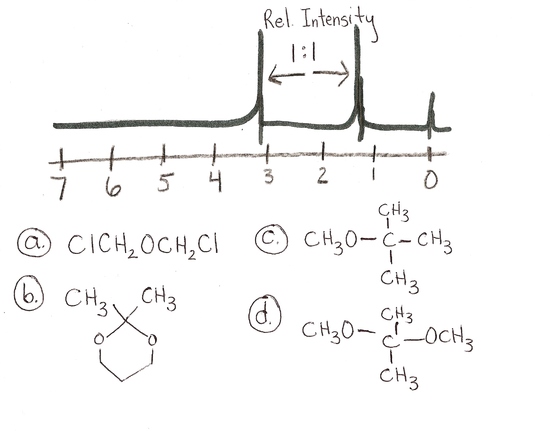
3


4.) scan0002.jpganswer is a and d
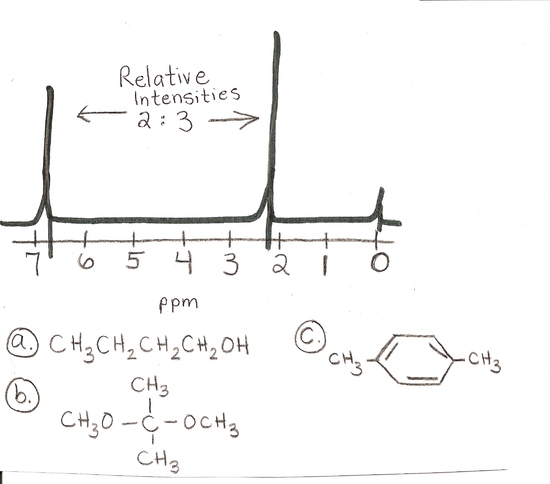
 scan0004.jpg

answer is c


Answers

  1. False. The relative number of hydrogens determines the intensity of a signal. The signal given by the three hydrogens in CH3CH2CHCl2 will not have the same intensity as the three hydrogens in ClCH2OCH3.
  2. There are 2 signals. One is at 3.3 ppm (6 hydrogens); the other at 3.5 ppm (4 hydrogens).
  3. a and d
  4. c

Number of Different Hydrogens


Ethyl acetate contains 8 hydrogens and some of them are different from each other. 
For example, those labeled A are attached to a carbon bonded to a carbonyl group and are different from the hydrogens labeled which are bonded to a carbon attached to an oxygen atom.

You can check whether certain hydrogens are the same or equivalent by replacing each hydrogen with some group X and seeing if you generate the same compound. You should convince yourself that replacing each hydrogen labeled A by X gives you identical compounds which are all equivalent by a C-C bond rotation. If this is difficult to "see" look at this molecular model of ethyl acetate to see if you can convince yourself that all the hydrogens labeled A are the same.

Integration

The area under the NMR resonance is proportional to the number of hydrogens which that resonance represents. In this way, by measuring or integrating the different NMR resonances, information regarding the relative numbers of chemically distinct hydrogens can be found. Experimentally, the integrals will appear as a line over the NMR spectrum.Integration only gives information on the relative number of different hydrogens, not the absolute number. 


 Review Questions


For ethyl acetate,
What ratio would you expect to see for the integrals for the hydrogens labeled A:B:C?
3-2-3
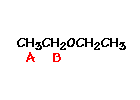
For ethyl ether,
What ratio would you expect to see for the integrals for the hydrogens labeled A:B?3-2
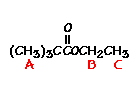
For t-butyl acetate,
What ratio would you expect to see for the integrals for the hydrogens labeled A:B:C?
6-2-3


ratio

2 3 3

or

4 6 6

Outside Links

References

  1. Schore, Neil E. and Vollhardt, K. Peter C. Organic Chemistry: Structure and Function. New York: Bleyer, Brennan, 2007. (405-407)
  2. UC Davis 118A Supplementary Booklet for the Laboratory/Discussion (Fall quarter 2008)_ Page 39

Tuesday, 22 July 2014

1-PENTANAL NMR


Formula: C5H10O
C5H10O
Rule 2, omit O, gives C5H10
5 - 10/2 + 1 = 1 degree of unsaturation.
Look for 1 pi bond or aliphatic ring.
IR spectrum
The band at 1727 indicates a carbonyl, probably an aldehyde; an aldehyde is also suggested by the band at 2719 which is likely the C-H stretch of the H-C=O group. The bands at 3000-2850 indicate C-H alkane stretches.


NMR spectrum

Structure answern

NMR answer

Proton NMR Spectrum

Since the IR spectrum indicates an aldehyde, look for this functionality in the NMR spectrum. The aldehydic proton appears in the NMR from 9-10, usually as a small singlet.
The spectrum above shows a small singlet corresponding to one proton at 9.2 ppm, confirming that the compound is an aldehyde. Protons on the carbon adjacent to the aldehyde carbonyl will show up at 2-2.7 ppm; this is the triplet peak of 2 protons at 2.4 ppm on the above spectrum. Thus, so far we know that there is an aldehyde group next to a methylene group which is next to a carbon that has two hydrogens:
This accounts for 3 of the 5 carbons in the molecule. The un-colored hydrogens in the above structure could correspond to the peak of 2 hydrogens centered at 1.6 ppm; this peak is a pentet indicating that these protons are adjacent to carbons with a total of 4 hydrogens. The peak centered at 1.35 ppm has two hydrogens and is a sextet, indicating it is next to carbons that have a total of 5 hydrogens. Finally, the peak at 0.9 ppm has 3 hydrogens and is a triplet, indicating it is a methyl group adjacent to a carbon that has 2 hydrogens. Therefore, it looks like the molecule is a straight-chain of 5 carbons with the aldehyde group at one end:
Note that the closer a group is to the carbonyl function, the further downfield it is shifted. Here is how the NMR correlates to the structure:
MASS SPECTRUM