Organic Chemists from Industry and academics to Interact on Spectroscopy Techniques for Organic Compounds ie NMR, MASS, IR, UV Etc. Starters, Learners, advanced, all alike, contains content which is basic or advanced, by Dr Anthony Melvin Crasto, Worlddrugtracker, email me ........... amcrasto@gmail.com, call +91 9323115463 India skype amcrasto64
................DR ANTHONY MELVIN CRASTO Ph.D ( ICT, Mumbai) , INDIA 25Yrs Exp. in the feld of Organic Chemistry,Working for GLENMARK GENERICS at Navi Mumbai, INDIA. Serving chemists around the world. Helping them with websites on Chemistry.Million hits on google, world acclamation from industry, academia, drug authorities for websites, blogs and educational contribution
In 13C[1H] NMR spectra of liquids, one observes a
single resonance for each symmetrically nonequivalent carbon atom. The
same is true of the 13C CPMAS spectra of solids. The
difference is that the molecular symmetry is the determining factor in
liquids NMR whereas the crystallographic symmetry is the determining
factor in solids NMR. As a result, solids NMR can give different spectra for different solid polymorphs
and multiple resonances due to multiple nonequivalent molecules in the
asymmetric unit of the crystal structure. The figure below compares the
solids 13C CPMAS and liquids 13C[1H] NMR spectra of a vitamin C (ascorbic acid) tablet.
The structure is provided in the figure and the assignment for all of
the carbon atoms is color coded. In the liquids spectrum, one observes
resonances for each carbon in the molecule. In the 13C CPMAS spectrum, one observes that three of the six 13C
resonances are doubled. This doubling is consistent with there being
two nonequivalent ascorbic acid molecules in the asymmetric unit of the
crystal. Presumably, the other three resonance are doubled as well but
there is insufficient resolution in the spectrum for this observation.
The broad features in the spectrum are due to additives in the vitamin C
tablet which include, hypromellose, stearic acid and carnauba wax.
In
previous entries in the Analytical Chemistry series of graphics, we’ve
looked at some of the tools that chemists can use to determine the
identity of compounds in various samples, including infrared spectroscopy and hydrogen nuclear magnetic resonance (NMR).
Today looks another similar method, that of carbon NMR; the graphic
provides some general information on interpreting the resultant spectra,
whilst we’ll briefly discuss how these signals are created below.
As
mentioned, we’ve already discussed nuclear magnetic resonance, or NMR,
in a previous post where hydrogen NMR was examined. That post also
provides a more thorough overview of how the signals are generated, and
the method for carbon-13 NMR is exactly the same – it’s just carbon
atoms that are involved, instead of hydrogen atoms.
Like hydrogen
atoms, some carbon atoms can have a property called ‘spin’. Spin is a
rather abstract concept, but at a simplified level, nuclei that possess
this property can be thought of as acting like very small magnets. These
magnets, when place in a magnetic field, can align either with or
against the field, and this is the basis of NMR. You’ll not I mentioned
some carbon atoms, not all. This is because not all carbon atoms have
spin; in fact, only carbon-13 atoms do.
Carbon-13 is slightly
different from carbon-12, the more abundant isotope of carbon, in that
it has an extra neutron in its nucleus, but otherwise its chemical
properties are the same. It accounts for just 1% of all carbon atoms,
with carbon-12 accounting for the other 99% (there are also some other
very low abundance isotopes). It’s the carbon-13 atoms, then, that are
responsible for the spectrum seen in carbon NMR, and carbon-12 atoms
play no part.
By way of a brief overview of the process by which
the spectrum is generated, the sample is put into a machine that can
apply both an external magnetic field to the sample, and irradiate it
with radio waves. Some machines vary the magnetic field strength and
keep the radio frequency fixed, whilst other vary the radio frequency
whilst the magnetic field remains the same. Either way, the result is
that the carbon-13 nuclei in the sample can absorb energy from the radio
waves and ‘flip’, so they are no longer aligned with the magnetic
field, but against it. This can be used to generate a signal, which is
where the peaks in the resultant spectrum come from.
Much like
hydrogen NMR, the environment of the carbon atoms (i.e., the other atoms
that it is in proximity to in the molecule) affect where a peak is seen
in the spectrum. A closer proximity to electronegative atoms such as
oxygen or nitrogen will result in the peak appearing further to the left
of the spectrum. Thus, the carbonyl compounds, which all contain a C=O
bond, appear on the left-hand side of the spectrum, whilst simpler,
alkyl groups containing only C–H bonds appear on the right-hand side of
the spectrum.
The low abundance of carbon-13 atoms means that the
spectra generated look a little different from those seen in hydrogen
NMR. First of all, you might wonder why spectra can be generated at all,
considering its low abundance, but bear in mind that even a very small
sample will contain millions upon millions of molecules. Therefore, even
that 1% of all carbon atoms becomes a large number, meaning a spectrum
can still be generated.
Secondly, if you’re familiar with hydrogen
NMR spectra, you’ll know that the peaks generated are often split into a
multitude of different peaks depending on how many other hydrogens are
in proximity on adjacent carbons in the molecule. This can add an extra
layer of complexity to interpreting the spectrum. With carbon-13,
however, this problem doesn’t exist. Considering their 1% abundance, the
probability of two carbon atoms appearing next to each other in the
same molecule is extremely low, so for the whole sample, no splitting of
peaks is seen. Actually, we would expect to see splitting as a result
of interaction with hydrogen nuclei in the sample too, but a technique
called ‘decoupling’ prevents this from being seen in the spectrum.
Why
is this useful? Well, it’s another item in the chemist’s toolkit that
allows us to identify unknown chemicals. Combined with both hydrogen NMR
and infrared spectroscopy, identifying simple molecules becomes much
easier. It can also give important pointers in more complex molecules.
As
always, it’s worth noting that the graphic is designed to give a
general overview of the rough points at which different carbon atoms in
different environments appear on the spectrum. These are approximate
values only, and can be affected by other substituent groups, as well as
the temperature and the solvent in which the sample is placed. Also, if
you want to read into the technique in more detail, there are some
further links provided below.
WHAT IS C-13 NMR?
This page describes what a C-13 NMR spectrum is and how it tells you useful things about the carbon atoms in organic molecules. The background to C-13 NMR spectroscopy
Nuclear magnetic resonance is concerned with the magnetic properties
of certain nuclei. On this page we are focussing on the magnetic
behaviour of carbon-13 nuclei. Carbon-13 nuclei as little magnets
About 1% of all carbon atoms are the C-13 isotope; the rest (apart
from tiny amounts of the radioactive C-14) is C-12. C-13 NMR relies on
the magnetic properties of the C-13 nuclei.
Carbon-13 nuclei fall into a class known as "spin ½" nuclei for
reasons which don't really need to concern us at the introductory level
this page is aimed at (UK A level and its equivalents).
The effect of this is that a C-13 nucleus can behave as a little magnet. C-12 nuclei don't have this property.
If you have a compass needle, it normally lines up with the Earth's
magnetic field with the north-seeking end pointing north. Provided it
isn't sealed in some sort of container, you could twist the needle
around with your fingers so that it pointed south - lining it up opposed
to the Earth's magnetic field.
It is very unstable opposed to the Earth's field, and as soon as you
let it go again, it will flip back to its more stable state.
Because a C-13 nucleus behaves like a little magnet, it means that it
can also be aligned with an external magnetic field or opposed to it.
Again, the alignment where it is opposed to the field is less stable
(at a higher energy). It is possible to make it flip from the more
stable alignment to the less stable one by supplying exactly the right
amount of energy.
The energy needed to make this flip depends on the strength of the
external magnetic field used, but is usually in the range of energies
found in radio waves - at frequencies of about 25 - 100 MHz. (BBC Radio
4 is found between 92 - 95 MHz!) If you have also looked at
proton-NMR, the frequency is about a quarter of that used to flip a
hydrogen nucleus for a given magnetic field strength.
It's possible to detect this interaction between the radio waves of
just the right frequency and the carbon-13 nucleus as it flips from one
orientation to the other as a peak on a graph. This flipping of the
carbon-13 nucleus from one magnetic alignment to the other by the radio
waves is known as the resonance condition. The importance of the carbon's environment
What we've said so far would apply to an isolated carbon-13 nucleus,
but real carbon atoms in real bonds have other things around them -
especially electrons. The effect of the electrons is to cut down the
size of the external magnetic field felt by the carbon-13 nucleus.
Suppose you were using a radio frequency of 25 MHz, and you adjusted
the size of the magnetic field so that an isolated carbon-13 atom was in
the resonance condition.
If you replaced the isolated carbon with the more realistic case of
it being surrounded by bonding electrons, it wouldn't be feeling the
full effect of the external field any more and so would stop resonating
(flipping from one magnetic alignment to the other). The resonance
condition depends on having exactly the right combination of external
magnetic field and radio frequency.
How would you bring it back into the resonance condition again? You
would have to increase the external magnetic field slightly to
compensate for the shielding effect of the electrons.
Now suppose that you attached the carbon to something more
electronegative. The electrons in the bond would be further away from
the carbon nucleus, and so would have less of a lowering effect on the
magnetic field around the carbon nucleus.
Note: Electronegativity is a measure of the ability of an atom to attract a bonding pair of electrons. If you aren't happy about electronegativity, you could follow this link at some point in the future, but it probably isn't worth doing it now!
The external magnetic field needed to bring the carbon into resonance
will be smaller if it is attached to a more electronegative element,
because the C-13 nucleus feels more of the field. Even small
differences in the electronegativities of the attached atoms will make a
difference to the magnetic field needed to achieve resonance. Summary
For a given radio frequency (say, 25 MHz) each carbon-13 atom will
need a slightly different magnetic field applied to it to bring it into
the resonance condition depending on what exactly it is attached to - in
other words the magnetic field needed is a useful guide to the carbon
atom's environment in the molecule. Features of a C-13 NMR spectrumThe C-13 NMR spectrum for ethanol
This is a simple example of a C-13 NMR spectrum. Don't worry about the scale for now - we'll look at that in a minute.
Note: The nmr spectra on this page have been produced from graphs taken from the Spectral Data Base System for Organic Compounds (SDBS) at the National Institute of Materials and Chemical Research in Japan.
It is
possible that small errors may have been introduced during the process
of converting them for use on this site, but these won't affect the
argument in any way.
There are two peaks because there are two different environments for the carbons.
The carbon in the CH3 group is attached to 3 hydrogens and a carbon. The carbon in the CH2 group is attached to 2 hydrogens, a carbon and an oxygen.
The two lines are in different places in the NMR spectrum because
they need different external magnetic fields to bring them in to
resonance at a particular radio frequency. The C-13 NMR spectrum for a more complicated compound
This is the C-13 NMR spectrum for 1-methylethyl propanoate (also known as isopropyl propanoate or isopropyl propionate).
This time there are 5 lines in the spectrum. That means that there
must be 5 different environments for the carbon atoms in the compound.
Is that reasonable from the structure?
Well - if you count the carbon atoms, there are 6 of them. So why
only 5 lines? In this case, two of the carbons are in exactly the same
environment. They are attached to exactly the same things. Look at the two CH3 groups on the right-hand side of the molecule.
You might reasonably ask why the carbon in the CH3 on the
left isn't also in the same environment. Just like the ones on the
right, the carbon is attached to 3 hydrogens and another carbon. But
the similarity isn't exact - you have to chase the similarity along the rest of the molecule as well to be sure.
The carbon in the left-hand CH3 group is attached to a carbon atom which in turn is attached to a carbon with two oxygens on it - and so on down the molecule.
That's not exactly the same environment as the carbons in the right-hand CH3 groups. They are attached to a carbon which is attached to a single oxygen - and so on down the molecule.
We'll look at this spectrum again in detail on the next page - and
look at some more similar examples as well. This all gets easier the
more examples you look at.
For now, all you need to realise is that each line in a C-13 NMR
spectrum recognises a carbon atom in one particular environment in the
compound. If two (or more) carbon atoms in a compound have exactly the same environment, they will be represented by a single line.
Note: If you are fairly wide-awake, you might wonder
why all this works, since only about 1% of carbon atoms are C-13.
These are the only ones picked up by this form of NMR. If you had a
single molecule of ethanol, then the chances are only about 1 in 50 of
there being one C-13 atom in it, and only about 1 in 10,000 of both
being C-13.
But you
have got to remember that you will be working with a sample containing
huge numbers of molecules. The instrument can pick up the magnetic
effect of the C-13 nuclei in the carbon of the CH3 group and the carbon of the CH2 group even if they are in separate molecules. There's no need for them to be in the same one.
The need for a standard for comparison - TMS
Before we can explain what the horizontal scale means, we need to
explain the fact that it has a zero point - at the right-hand end of the
scale. The zero is where you would find a peak due to the carbon-13
atoms in tetramethylsilane - usually called TMS. Everything else is compared with this.
You will find that some NMR spectra show the peak due to TMS (at
zero), and others leave it out. Essentially, if you have to analyse a
spectrum which has a peak at zero, you can ignore it because that's the
TMS peak.
TMS is chosen as the standard for several reasons. The most important are:
It has 4 carbon atoms all of which are in exactly the same
environment. They are joined to exactly the same things in exactly the
same way. That produces a single peak, but it's also a strong peak
(because there are lots of carbon atoms all doing the same thing).
The electrons in the C-Si bonds are closer to the carbons in this
compound than in almost any other one. That means that these carbon
nuclei are the most shielded from the external magnetic field, and so
you would have to increase the magnetic field by the greatest amount to
bring the carbons back into resonance.
The net effect of this is that TMS produces a peak on the spectrum at
the extreme right-hand side. Almost everything else produces peaks to
the left of it.
The chemical shift
The horizontal scale is shown as (ppm). is called the chemical shift and is measured in parts per million - ppm.
A peak at a chemical shift of, say, 60 means that the carbon atoms which caused that peak need a magnetic field 60 millionths less than the field needed by TMS to produce resonance.
A peak at a chemical shift of 60 is said to be downfield of TMS. The further to the left a peak is, the more downfield it is.
Note: If you are familiar with proton-NMR, you will
notice that the chemical shifts for C-13 NMR are much bigger than for
proton-NMR. In C-13 NMR, they range up to about 200 ppm. In proton-NMR
they only go up to about 12 ppm. You don't need to worry about the
reasons for this at this level.
Solvents for NMR spectroscopy
NMR spectra are usually measured using solutions of the substance being investigated. A commonly used solvent is CDCl3. This is a trichloromethane (chloroform) molecule in which the hydrogen has been replaced by its isotope, deuterium.
CDCl3 is also commonly used as the solvent in proton-NMR
because it doesn't have any ordinary hydrogen nuclei (protons) which
would give a line in a proton-NMR spectrum. It does, of course, have a
carbon atom - so why doesn't it give a potentially confusing line in a
C-13 NMR spectrum?
In fact it does give a line, but the line has an easily
recognisable chemical shift and so can be removed from the final
spectrum. All of the spectra from the SDBS have this line removed to
avoid any confusion. Update November 2014:
If you have already read the introductory page about proton NMR, you
may have read a similar note to this. If so, there is no real need to
read it again.
In the explanations above, I have described an NMR spectrum as being
produced by having a fixed radio frequency, and varying the magnetic
field to find the resonance conditions for the C-13 atoms in their
various environments.
It has been pointed out to me that newer NMR machines actually fix
the magnetic field and vary the radio frequency instead. In fact, the
most modern machines send a pulse covering a wide spectrum of radio
frequencies, and use a computer to sort it all out afterwards.
Do you need to worry about this? No. Provided you are meeting this
at an introductory level for exams at an age of about 18, it is pretty
unlikely that you will need details of how the machines work. What
matters is that you can interpret the resulting NMR spectra.
Personally, I prefer the version involving changing the magnetic
field because it is much more obvious to explain, even if the method
itself is a bit old-fashioned. You may not need to bother about this next bit!
If you have come across this alternative method, some of the wording
will be different, and that's all. Check your past exam papers and
marks schemes to see whether your examiners ever ask questions about how
NMR spectra are produced, and which method they talk about.
If they never ask questions about it, or if they expect answers in terms of varying the magnetic field, stop here! What differences are there if you vary the frequency?
Think about TMS, the standard which has the maximum amount of
magnetic shielding of the carbon atoms by the electrons. That reduces
the strength of the magnetic field experienced by the carbon nuclei more
than in any other carbon compound. It therefore needs the maximum
increase in the external magnetic field to reach the resonance condition
if you are varying the magnetic field.
But what if you are varying the frequency of the radio waves instead of the magnetic field?
The weaker magnetic field experienced by the carbon nuclei in TMS
will reduce the energy gap between the two states the carbon nuclei can
take up - aligned with and against the magnetic field.
Think about it like this:
Suppose you had the compass needle described at the beginning of this
page surrounded by a fairly weak magnetic field. It wouldn't take much
effort to move it so that it was aligned against the magnetic field.
The energy gap between the two states would be pretty small.
Now suppose it was in an intense magnetic field. It would be very
difficult to move it so that it was aligned against the field. The
energy gap would be much increased by the stronger magnetic field.
So the carbon atoms in TMS, which are better shielded by the
electrons around them than any other carbon compound, will have the
smallest energy gap between the two states.
The energy of the radio waves is related to their frequency. That
means that if you are varying the frequency, TMS will need a lower
frequency than any other carbon compound to bring it into resonance.
That has taken a long time to say, but it comes down to the fact that
If you are varying magnetic field, TMS will need the greatest external magnetic field to reach the resonance condition.
If you are varying the radio wave frequencies, TMS will need the lowest frequency to reach the resonance condition.
The delta shift works exactly the same in both cases.
A delta shift of 60 means that a particular compound needs a
magnetic field 60 millionths less than that of TMS to reach resonance.
A delta shift of 60 means that a particular compound needs a
radio frequency 60 millionths more than that of TMS to reach resonance.
DO NOT learn both of these. Just learn the way your examiners
expect. None of this makes any difference to the way NMR spectra are
interpreted which is probably all you need anyway.
Interpreting C-13 NMR Spectra
This page takes an introductory look at how you can get useful information from a C-13 NMR spectrum.
Introduction
Taking a close look at three 13C NMR spectra below. The 13C NMR spectrum for ethanol
Note
The nmr spectra on this page have been produced from graphs taken from the Spectral Data Base System for Organic Compounds (SDBS) at theNational Institute of Materials and Chemical Research in Japan.
Remember
that each peak identifies a carbon atom in a different environment
within the molecule. In this case there are two peaks because there are
two different environments for the carbons. The carbon in the CH3 group is attached to 3 hydrogens and a carbon. The carbon in the CH2group is attached to 2 hydrogens, a carbon and an oxygen. So which peak is which?
You
might remember from the introductory page that the external magnetic
field experienced by the carbon nuclei is affected by the
electronegativity of the atoms attached to them. The effect of this is
that the chemical shift of the carbon increases if you attach an atom
like oxygen to it. That means that the peak at about 60 (the larger
chemical shift) is due to the CH2 group because it has a more
electronegative atom attached.
Note
In
principle, you should be able to work out the fact that the carbon
attached to the oxygen will have the larger chemical shift. In practice,
you always work from tables of chemical shift values for different
groups (see below).
What
if you needed to work it out? The electronegative oxygen pulls
electrons away from the carbon nucleus leaving it more exposed to any
external magnetic field. That means that you will need a smaller
external magnetic field to bring the nucleus into the resonance
condition than if it was attached to less electronegative things. The
smaller the magnetic field needed, the higher the chemical shift.
A table of typical chemical shifts in C-13 NMR spectra
carbon environment
chemical shift (ppm)
C=O (in ketones)
205 - 220
C=O (in aldehydes)
190 - 200
C=O (in acids and esters)
170 - 185
C in aromatic rings
125 - 150
C=C (in alkenes)
115 - 140
RCH2OH
50 - 65
RCH2Cl
40 - 45
RCH2NH2
37 - 45
R3CH
25 - 35
CH3CO-
20 - 30
R2CH2
16 - 25
RCH3
10 - 15
In
the table, the "R" groups won't necessarily be simple alkyl groups. In
each case there will be a carbon atom attached to the one shown in red,
but there may well be other things substituted into the "R" group.
If
a substituent is very close to the carbon in question, and very
electronegative, that might affect the values given in the table
slightly.
For example, ethanol has a peak at about 60 because of the CH2OH group. No problem! It also has a peak due to the RCH3 group. The "R" group this time is CH2OH.
The electron pulling effect of the oxygen atom increases the chemical
shift slightly from the one shown in the table to a value of about 18.
A simplification of the table:
carbon environment
chemical shift (ppm)
C-C
0 - 50
C-O
50 - 100
C=C
100 - 150
C=O
150 - 200
This
may, of course, change and other syllabuses might want something
similar. The only way to find out is to check your syllabus, and recent
question papers to see whether you are given tables of chemical shifts
or not.
Example: 3-buten-2-one
The 13C NMR spectrum for but-3-en-2-one. This is also known as 3-buten-2-one (among many other things!)
Here is the structure for the compound:
You can pick out all the peaks in this compound using the simplified table above.
The
peak at just under 200 ppm is due to a carbon-oxygen double bond. The
two peaks at 137 ppm and 129 ppm are due to the carbons at either end of
the carbon-carbon double bond. And the peak at 26 is the methyl group
which, of course, is joined to the rest of the molecule by a
carbon-carbon single bond. If you want to use the more accurate table,
you have to put a bit more thought into it - and, in particular, worry
about the values which do not always exactly match those in the table!
The
carbon-oxygen double bond in the peak for the ketone group has a
slightly lower value than the table suggests for a ketone. There is an
interaction between the carbon-oxygen and carbon-carbon double bonds in
the molecule which affects the value slightly. This isn't something
which we need to look at in detail for the purposes of this topic.
You
must be prepared to find small discrepancies of this sort in more
complicated molecules - but do not worry about this for exam purposes at
this level. Your examiners should give you shift values which exactly
match the compound you are given.
The
two peaks for the carbons in the carbon-carbon double bond are exactly
where they would be expected to be. Notice that they aren't in exactly
the same environment, and so do not have the same shift values. The one
closer to the carbon-oxygen double bond has the larger value.
And
the methyl group on the end has exactly the sort of value you would
expect for one attached to C=O. The table gives a range of 20 - 30, and
that's where it is.
One
final important thing to notice. There are four carbons in the molecule
and four peaks because they are all in different environments. But they
aren't all the same height. In C-13 NMR, you cannot draw any simple conclusions from the heights of the various peaks.
Example 1: C-13 NMR spectrum for 1-methylethyl propanoate
1-methylethyl propanoate is also known as isopropyl propanoate or isopropyl propionate.
Here is the structure for 1-methylethyl propanoate:
Two simple peaks
There are two very simple peaks in the spectrum which could be identified easily from the second table above.
The
peak at 174 is due to a carbon in a carbon-oxygen double bond. (Looking
at the more detailed table, this peak is due to the carbon in a
carbon-oxygen double bond in an acid or ester.)
The peak at 67 is due to a different carbon singly bonded to an oxygen. Those two peaks are therefore due to:
If
you look back at the more detailed table of chemical shifts, you will
find that a carbon singly bonded to an oxygen has a range of 50 - 65. 67
is, of course, a little bit higher than that.
As
before, you must expect these small differences. No table can account
for all the fine differences in environment of a carbon in a molecule.
Different tables will quote slightly different ranges. At this level,
you can just ignore that problem!
Before
we go on to look at the other peaks, notice the heights of these two
peaks we've been talking about. They are both due to a single carbon
atom in the molecule, and yet they have different heights. Again, you
can't read any reliable information directly from peak heights in these
spectra.
The three right-hand peaks
From
the simplified table, all you can say is that these are due to carbons
attached to other carbon atoms by single bonds. But because there are
three peaks, the carbons must be in three different environments.
The
easiest peak to sort out is the one at 28. If you look back at the
table, that could well be a carbon attached to a carbon-oxygen double
bond. The table quotes the group as CH3CO−
, but replacing one of the hydrogens by a simple CH3 group won't make much difference to the shift value.
The
right-hand peak is also fairly easy. This is the left-hand methyl group
in the molecule. It is attached to an admittedly complicated R group
(the rest of the molecule). It is the bottom value given in the detailed
table.
The
tall peak at 22 must be due to the two methyl groups at the right-hand
end of the molecule - because that's all that's left. These combine to
give a single peak because they are both in exactly the same
environment.
If
you are looking at the detailed table, you need to think very carefully
which of the environments you should be looking at. Without thinking,
it is tempting to go for the R2CH2 with peaks in the 16 - 25 region. But you would be wrong!
The
carbons we are interested in are the ones in the methyl group, not in
the R groups. These carbons are again in the environment: RCH3. The R is
the rest of the molecule.
The
table says that these should have peaks in the range 10 - 15, but our
peak is a bit higher. This is because of the presence of the nearby
oxygen atom. Its electronegativity is pulling electrons away from the
methyl groups - and, as we've seen above, this tends to increase the
chemical shift slightly.
Working out structures from C-13 NMR spectra
So
far, we have just been trying to see the relationship between carbons
in particular environments in a molecule and the spectrum produced.
We've had all the information necessary. Now let's make it a little more
difficult - but we'll work from much easier examples! In each example,
try to work it out for yourself before you read the explanation.
How
could you tell from just a quick look at a C-13 NMR spectrum (and
without worrying about chemical shifts) whether you had propanone or
propanal (assuming those were the only options)?
Because
these are isomers, each has the same number of carbon atoms, but there
is a difference between the environments of the carbons which will make a
big impact on the spectra.
In
propanone, the two carbons in the methyl groups are in exactly the same
environment, and so will produce only a single peak. That means that
the propanone spectrum will have only 2 peaks - one for the methyl
groups and one for the carbon in the C=O group. However, in propanal,
all the carbons are in completely different environments, and the
spectrum will have three peaks.
Example 2: C4H10O
There are four alcohols with the molecular formula C4H10O
.
Which one produced the C-13 NMR spectrum below?
You can do this perfectly well without referring to chemical shift tables at all.
In
the spectrum there are a total of three peaks - that means that there
are only three different environments for the carbons, despite there
being four carbon atoms.
In A and B, there are four totally different environments. Both of these would produce four peaks.
In D, there are only two different environments - all the methyl groups are exactly equivalent. D would only produce two peaks.
That
leaves C. Two of the methyl groups are in exactly the same environment -
attached to the rest of the molecule in exactly the same way. They
would only produce one peak. With the other two carbon atoms, that would
make a total of three. The alcohol is C.
Example 3
This follows on from Example 2, and also involves an isomer of C4H10O
but which isn't an alcohol. Its C-13 NMR spectrum is below. Work out what its structure is.
Because
we do not know what sort of structure we are looking at, this time it
would be a good idea to look at the shift values. The approximations are
perfectly good, and we will work from this table:
carbon environment
chemical shift (ppm)
C-C
0 - 50
C-O
50 - 100
C=C
100 - 150
C=O
150 - 200
There
is a peak for carbon(s) in a carbon-oxygen single bond and one for
carbon(s) in a carbon-carbon single bond. That would be consistent with
C-C-O in the structure.
It
is not an alcohol (you are told that in the question), and so there
must be another carbon on the right-hand side of the oxygen in the
structure in the last paragraph. The molecular formula is C4H10O,
and there are only two peaks. The only solution to that is to have two
identical ethyl groups either side of the oxygen. The compound is
ethoxyethane (diethyl ether), CH3CH2OCH2CH3.
Example 4
Using
the simplified table of chemical shifts above, work out the structure
of the compound with the following C-13 NMR spectrum. Its molecular
formula is C4H6O2
.
Let's sort out what we've got.
There are four peaks and four carbons. No two carbons are in exactly the same environment.
The peak at just over 50 must be a carbon attached to an oxygen by a single bond.
The two peaks around 130 must be the two carbons at either end of a carbon-carbon double bond.
The peak at just less than 170 is the carbon in a carbon-oxygen double bond.
Putting
this together is a matter of playing around with the structures until
you have come up with something reasonable. But you can't be sure that
you have got the right structure using this simplified table. In this
particular case, the spectrum was for the compound:
If
you refer back to the more accurate table of chemical shifts towards
the top of the page, you will get some better confirmation of this. The
relatively low value of the carbon-oxygen double bond peak suggests an
ester or acid rather than an aldehyde or ketone.
It
can't be an acid because there has to be a carbon attached to an oxygen
by a single bond somewhere - apart from the one in the -COOH group.
We've already accounted for that carbon atom from the peak at about 170.
If it was an acid, you would already have used up both oxygen atoms in
the structure in the -COOH group.
Without
this information, though, you could probably come up with reasonable
alternative structures. If you were working from the simplified table in
an exam, your examiners would have to allow any valid alternatives.
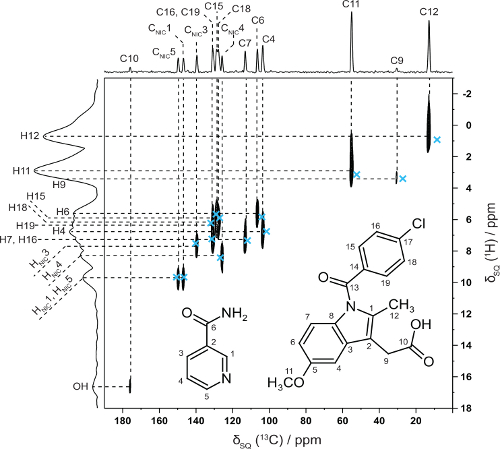
In collaboration with Professor Kenneth Harris, Cardiff University we have shown how NMR crystallography (CCPNC)
can be used in synergy with structure solution by powder X-ray
diffraction diffraction for an indomethacin-nicotinamide co-crystal –
note the excellent 2D agreement with calculated (GIPAW, blue crosses) 13C and 1H chemical shifts for directly bonded CHs. (Dudenko 2013).
View current batch:
COANMRHPLCDatasheetM An improved synthesis of indole derivatives related to Indomethacin from natural Safrole
Eliezer J. Barretro*, Paulo R.R. Costa**, Perola Regina V.R. Barros and Waldemir M. Queiroz.
* Departamento de Quimica, Universidade Federal de Sao Carlos, 13.560, Sao Carlos, S.P., Brazil. ** Nucleo de Pesquisas de Produtos Naturais, Universidade Federal de Rio de Janeiro, Bl. N, 21.941, R.J., Brazil.
The indole moiety is present in a great number of natural and synthetic biologically active compounds1. Particulary in the group of non-steroidal antiinflammatory agents (NSAIA)2, among other aryl acetic acids, indomethcain 13
occupies an outstanding position. In view of the continous efforts in
the preparation and pharmacological evaluation of new NSAIA4, we became interested in preparing analogues of 1,
using abundant and readily accessible natural products as inexpensive
starting materials. With this objective in mind, the indolyl-acetic
esters 2 and 3 were chosen as initial target compounds. Using natural safrole 45
as starting material it was possible to develop under mild conditions, a
synthetic sequence of high yield in which the key in the preparation of
2 and 3 is a reductive cyclization of the appropriate nitro-[beta]-keto ester 5 and 6 (Scheme 1).
In order to obtain 5 (Scheme II) the double bond of 4 was oxidized affording epoxysafrole 7 in good yields. As expected6 this compound produces the alcohol 8 (90%) by a regiospecific oxirane ring hydrogenolysis (method B). Nitration of 8 in very mild conditions 7 (HNO3)/CHCl3) gave 9 in quantitative yield. Alternatively, the alcohol 8 (93%) was synthesized by an oxymercuration-demercuration sequence8 (method A) from 4. The next step in the choosen synthetic sequence was the preparation of the methylketones 10 and 11 that was attempted by oxidation of the alcohols 8 and 9 with pyridinium chlorochromate (PCC)9 (method A) or Jones' reagent10 (method B). The nitro methylketone 12 could be C-alkylated with ethyl bromoacetate, using the intensely violet colored benzylic enolate, prepared by treatment of 12 with sodium hydride in dimethylformamide11, to furnisch the desired ester (78%). On the other hand, the lithium benzylic enolate, generated by treatment of 10 with lithium diisopropylamide (LDA) in tetrahydrofuran 12, was C-alkylated to provide the ketoesters 11 (85%) which by nitration gave 5 (98%).
Scheme I
Scheme II
Scheme III
In order to obtain the nitro-[beta]-keto esters 6, we developed the synthetic route described in Scheme III. Thus, reaction of 4 with N-bromosuccinmide (NBS) in acetone/water produces a mixture of isomeric bromohydrins 13a-c13. This mixture was treated with sodium cyanide in methanol under reflux, and the crude reaction product 14 submitted to a careful alkaline hydrolysis14 (H2O2, EtOH, 6N NaOH) gave the desired amid 15 as the sole
product to crystallize as a clean colourless material from the reaction
mixture. This useful sequence can be run on a 30 g scale without
isolation of intermediates, in 50% overall yield. Alternatively, the
bromohydrin 13a can prepared in quantitative yield by direct bromination of 7. The formation of this dibromo compound 13a
can be understood by initial bromination of the 5-position of the
aromatic ring followed by regioselective opening of the oxirane15 ring by the hydrobromic acid liberated in the reaction medium. A pure sample of 14 could be obtained (65%) by reaction of 13a with sodium cyanide in methanol. The conversion of 15 into hydroxy acid 16 (90%) was attempted by akaline hydrolysis. A one pot procedure for the transformation of 16 into 17
was accomplished in 75% yield by hydrogenolysis of C-Br bond over Pd/C
using methanol as solvent that permits the acid catalytic esterification
by action of the hydrobromic acid formed in the reaction vessel.
Finally, nitration of 17 gave 18 (90%) which, when submitted to oxidation with PCC9 or Jones' reagent10 provided the nitro-[beta]-keto ester 6 in 80% yield.
With the nitro-[beta]-keto esters 5 and 6 in hand we proceeded to the last key step of the synthetic route, viz, the reductive cyclization reaction16 to provide the indole derivations 2 and 3.
So, when a methanolic solution of 5 was submitted to catalytic reduction (H2,
Pd/C 60 psi) for 15 minutes at room temperature, immediately followed
by solvent elimination in vacuum and subsequent "flash" chromatography
filtration over silica gel, the desired indole 2 could be obtained in 80% yield, in the form of a clear oil. On the other hand, catalytic reduction of 6, under identical conditions, afforded 3 as pale yellow crystals (85%).
In
conclusion, the synthetic sequence here described is useful for the
preparation of indoleacetic esters starting from the allylbenzene moiety
present in various abundant natural compounds such as safrole 4. The potential biologically active indole derivatives 2 and 3 can be prepared in high overall yields (46% and 20% respectively) using easily acessible reagents and mild reaction conditions.
We
are indebted to the Conselho Nacional de Desenvolvimento Cientifico e
Tecnologico (40.1424/80) for financial support and fellowships to PRVRB
and VMQ, to Professor Walter B. Mors (NPPN, UFRJ), for his continous
encouragement and to Professor Timothy J. Srcokson (UFSCan) for his
valuable suggestions.
References:
1. Pharm. Acta. Helv., 1973, 53, 65 2. Ann. Rept. Med. Chem., 1975, 10, 172, Ann Rept. Med. Chem., 1974, 9, 193 3. U.S Paten, 3, 242, 185 (Chem. Abstr., 1966, 64, 17555) 4.
Inter-Alia: T.Y. Shen, J. Med. Chem., 1981, 24, 1; G.Y. Paris, D.L.
Germaise, D.G. Cimon, L. Swett, G.W. Carter and P. Young, J. Med. Chem.,
1980, 23, 9; D. Evans, D.W. Kunwell and T.A. Hicks, Australian (1970),
506, 085 (Chem. Abstr., 1980, 92, 169251t); M. Nagakura, T. Ota, N.
Shimidzu, K. Kawamura, Y. Eto and Y. Wada, J. Med. Chem., 1979, 22, 48;
J. Jeske and K. Stoskla, Acta Pol. Pharm., 1978, 35, 611. 5. W.B. Mors and C.T. Rizzini, "Botanica Economica", Epu, Sao Paulo, S.P., Brazil, 1976, p. 149. 6. R.L. Augustine, "Catalytic Hydrogenation", E. Arnold (Publishers), LTD, London and M. Dekker, Inc., New Yorik, 1965, p. 137 7. cf. D.R. Buckle; D.J. Outred, J.W. Ross., H. Smith, R.J. Smith, B.A. Spices and B.C. Gasson, J. Med. Chem., 1979, 22, 158. 8. H.C. Brown and P.G. Georghegan Jr., J. Org. Chem., 1970, 55, 1844. 9. E.J. Corey and W. Suggs, Tetrahedron Lett., 1975, 2647 10
The Jones' reagent was prepared as descripted in L.F. Fieser and M.
Fieser, "Reagents for Organic Synthesis", John Wiley and Sons, Inc., New
York, vol. I, p. 142 11. I.K. Stamos, Synthesis, 1980, 664 12 J.P. Albarella, J. Org. Chem., 1977, 42, 2009 13. The formation of 14c can be explained by the participation of a phenonium ion intermedite: Tetrahedron Lett., 1975, 4535. 14. C.R. Noller, "Organic Synthesis", Coll. II, John Wiley and Sons, Inc., New York, p. 586. 15. Treatment of epoxyde 7 with hydrobromic acid in acetone:water gives exclusively 4-(3-bromo-2-hydroxypropyl)-1,2-methylen
dioxybenzene. 16. We have published previously the cyclization of 12 to 5,6-methylendioxy-2-methylindole in 60% yield17. Using the modified conditions described here this transformation could be accomplished in 90% yield. 17. cf. E.J. Barreiro, P.R.R. Costa, R.T. de Wello and P.R.V.R. Barros, An. Acad. brasil. Cienc., 1981, 53, 65.
Experimental
The 1H
NMR spectra were run with Varian XL-100-12 (100 MHz) and Varian EM-360
(60 MHz) instruments, using the indicated solvent and Me4Si
as internal reference. The i.r. spectra were recorded with a
Perkin-Elmer 137-8 spectrophotometer, using KBr pellets. The u.v.
spectra were recorded with a Beckman DGB spectrophotometer using EtOH
(Uvasol) as solvent. The mass spectra were obtained with a Varian
MAT-CH5-DF instrument coupled to a Varian MAT SS-100 computer system.
The m.p. were determined in a Kofler apparatus. The hydrogenation
reactions were performed in a Parr apparatus. Combustion analyses were
carried out by CENPES - Petrobras (Rio de Janeiro, Brazil).
4-(2-Hydroxypropyl)-1,2-methylendioxy (8) Method A - Oxymercuration-Demercuration of safrole (4)
Safrole (12.43 g, 76.7 mmol) was gradually added to a stirred solution of Hg(OAc)2 (25.0 g, 78.6 mmol) in THF (230 ml):H2O
(75 ml). After 1 h at room temperature the yellow color was discharged
and the reaction mixture was alkalinized (3M NaOH aq., 75 ml) followed
by addition of a solution of NaBH4 (1.45 g, 38.15 mmol) in 3M
aq. NaOH (75 ml). After 1 h the reaction mixture was saturated with
NaCl, the organic layers separated and the aqeuous layer was extracted
with EtOAc (4x250 ml). The combined organic layers were then washed
successively with H2O (3x100 ml) and saturated brine, dried (anhy. Na2SO4) and evaporated to give 8
(12.7 g, 96%) as a clean viscous oil. An analytical sample was obtained
by chromatography on silical gel using hexane-EtOAc (8:2) as eluent.
Method B - Hydrogenolysis of epoxysafrole (7)
A mixture of 7
(5.0 g, 27.7 mmoles) and 10% Pd/C (1.0 g) in MeOH (30 ml) was submitted
to hydrogen pressure (65 psi). After 3 h the catalyst was filtered and
the solvent evaporated to affort 8 (4.55 g, 90%) as a clear brown oil.
To a solution of 8 in CHCl3 (110 ml) was added HNO3 (d = 1.52, 3.62 ml). After 40 minutes at room temperature the reaction was neutralized with Na2CO3 aq., washed with H2O, dried (Na2SO4) and evaporated furnishing 9. (0.75 g, 100%) as yellow solid: m.p. 117-119°C from AcOH:H2O [...]
In a 1.5 mmol scale 11 was nitrated as described above to give as product a clear brown oil. This residue crystallized from AcOH-H2O gave 5 (80%): m.p. 96-98°C [...]
In a 30 mmol scale 17 was nitrated as already described to give a brown solid. Recrystallization of the crude product from AcOH:H2O gave as yellow crystals: m.p.. 106-109°C [...]
PCC-Oxidations (Method A)
Oxidation of 5-nitro-4-(3-methoxycarbonyl-2-hydroxypropyl)-1,2-methylendioxybenzene (18)
A mixture of 18 (1.41 g, 5.0 mmol) and PCC (3.23, 15.0 mmol) in CH2Cl2 (75 ml) was allowed to react overnight at room temperature. The solvent was separated by filtration and residue washed with CH2Cl2 (2 x 50 ml). The combined organic fractions were evaporated and the residue filtered over silica gel (40 g) using CH2Cl2 as eluent, giving 6 (1.11 g, 80%) as a yellow solid: m.p. 86°C from AcOH-H2O [..]
Oxidation of 4-(2-hydroxypropyl)-1,2-methylendioxybenzene (8
In a 3 mmol scale the oxidation of 8 as described above followed by filtration of the crude product over silica gel gave 10 (75%) as a colorless oil: vmax 1720 cm-1, [delta]H (60 MHz, CCl4) 6.60 (3 H, narrow, m), 5.87 (2 H, s), 3.46 (2 H, s), 2.00 (3 H, s) ppm; m/z 178 (M+, 20%), 135 (100%).
Oxidation of 5-nitro-4-(1-hydroxypropyl)-1,2-methylendioxybenzene (9)
In a 30 mmol scale the oxidation of 9 as already described gave 12 (86%) as yellow crystals: m.p. 139-141°C from AcOH-H2O [...]
Jones Oxidations (Method B)
Oxidation of 5-Nitro-4-(2-hydroxypropyl)-1,2-methylendioxybenzene (9)
To an ice cold solution of 9 (1.1 g, 4.9 mmol) in CH3COCH3 redistilled from KMnO4 (70 ml) was added dropwise a solution of Jones' reagent10 until a slight excess was present (2.0 ml), followed by addition of a saturated solution of NaHSO3
(10 ml). The organic layer was separated and the residue extracted with
EtOAc (3 x 100 ml). The combined organic extrats were washed with aq.
NaHCO3 (50 ml), H2O (50 ml), saturated brine, dried (Na2SO4) and evaporated. The residue crystallized from AcOH-H2O gave 12 (0.89 g, 80%).
Oxidation of 4-(3-hydroxypropyl)-1,2-methylendioxybenzene (8)
In a 1.5 mmol scale 8 was oxidized as above giving 10 in 78% yield, after purification by preparative TLC over silica gel.
Oxidation of 5-Nitro-4-(3-methoxycarbonyl-2-hydroxypropyl)-1,2-methylendioxybenzene (18)
In a 10 mmol scale the Jones' oxidation of 18 was run as above affording 6 as a crystalline yellow solid crystallized from AcOH-H2O in 72% yield.
 .
.


 .
.