The 2D NMR experiment belongs as well to the Fourier transform spectroscopy than to the impulsion one and relies on a sequence of three time intervals: preparation, evolution and. In some experiment another time interval is added before the detection: the mixing time.
 Fig.8 : Scheme for time pulse in a 2D NMR experiment
The 2D NMR experiment belongs as well to the Fourier transform spectroscopy than to the impulsion one and relies on a sequence of three time intervals: preparation, evolution and. In some experiment another time interval is added before the detection: the mixing time.
Fig.8 : Scheme for time pulse in a 2D NMR experiment
The preparation time
Upon the preparation time the spin system under study is firstly prepared, for example it is submitted either to a decoupling experiment or just to a transverse magnetization by the means of a 90° impulsion. It allows the excited nuclei to get back their equilibrium state between two successively executed pulse
The 2D NMR - The idea of JEENER
The idea of Jeener consists in the stepwise increasing of the evolution time  .
.
.
This will allow to get an NMR signal under the aspect of a sampling of free precession signals of the  type. These FID will differ from each other only by the
  period duration written under a matricial form
type. These FID will differ from each other only by the period duration written under a matricial form
s( ,  ). The delay is the time between the first and the second pulse.
, ). The delay is the time between the first and the second pulse.
Fig. 9 : Sampling of signals of free precession of the type s(t2)
The first Fourier transform as a function of gives us an interferogram of the form  (Fig. 10)
gives us an interferogram of the form (Fig. 10)
Fig. 10 : Interferogram of the form s(t2, w1)
A second Fourier transform, versus the second variable , gives an NMR spectrum with two frequencies dimensions F1 and F2.
, gives an NMR spectrum with two frequencies dimensions F1 and F2.
The result of this two fold Fourier transform does not get two spectra  and
and  but only one spectrum as a function of two independent frequencies, exhibiting a peak with the coordinates
  . Thus, an aimantation evolving with the frequency
  in the time course has been converted in another coherence evolving with the frequency
  during the period .
and but only one spectrum as a function of two independent frequencies, exhibiting a peak with the coordinates . Thus, an aimantation evolving with the frequency in the time course has been converted in another coherence evolving with the frequency during the period .
Fig. 11 : NMR spectrum in two dimensions following the second Fourier transform
This double Fourier transform in both dimension yields thus a matrix  (spectrum 3).
Take a tour
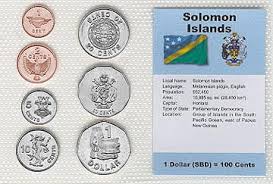
SOLOMON ISLANDS


HONIARA

Malaita, Solomon Islands ...


 .
.


 .
.
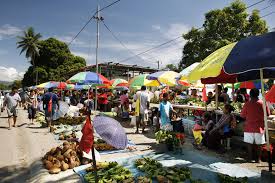
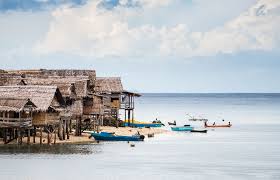
Gizo, on Ghizo Island, is the capital of the Solomon Islands’ far-flung Western Province, a paradise of coral cays, atolls, lagoons and volcanic islands east of Papua New Guinea where, on a rainy day in late July, crowds flocked to the local netball court for the opening of the inaugural Akuila Talasasa Arts Festival.
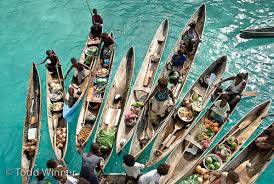
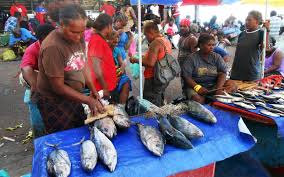
 Motorised canoes lined up in Gizo Harbour near the daily marketplace.


 .
.


///////// You mi
(spectrum 3).Take a tour
SOLOMON ISLANDS
HONIARA
Malaita, Solomon Islands ...
.Gizo, on Ghizo Island, is the capital of the Solomon Islands’ far-flung Western Province, a paradise of coral cays, atolls, lagoons and volcanic islands east of Papua New Guinea where, on a rainy day in late July, crowds flocked to the local netball court for the opening of the inaugural Akuila Talasasa Arts Festival.
///////// You mi


