DR ANTHONY MELVIN CRASTO,WorldDrugTracker, helping millions, A 90 % paralysed man in action for you, I am suffering from transverse mylitis and bound to a wheel chair, With death on the horizon, nothing will not stop me except God................DR ANTHONY MELVIN CRASTO Ph.D ( ICT, Mumbai) , INDIA 25Yrs Exp. in the feld of Organic Chemistry,Working for GLENMARK GENERICS at Navi Mumbai, INDIA. Serving chemists around the world. Helping them with websites on Chemistry.Million hits on google, world acclamation from industry, academia, drug authorities for websites, blogs and educational contribution

Saturday 17 October 2015

Infrared Spectroscopy,Characterisation of Organic Compounds

This discussion is on infrared (IR) spectroscopy which tells about the functional groups in the molecule.

William de Wiveleslie Abney

Almost any compound having covalent bonds absorbs various frequencies of electromagnetic radiation in the infrared region of the electromagnetic spectrum. This region lies at wavelength longer than those associated with visible light, which range from approximately 400 to 800 nm, but lies at wavelengths shorter than those associated with microwaves, which are longer than 1 mm. For chemical purposes, we are interested in the vibrational portion of the infrared region. It includes radiations with wavelengths between 2.5 μm and 25 μm.


In the early use of IR spectroscopy in 1882, William Abney managed to identify 52 benzene derivatives from the IR spectroscopy. IR spectroscopy is used to see the the functional group in the molecule as the bonds vibrates at certain wavenumber and it only vibrate at only certain allowable frequencies. 

The covalent bonds in a molecule can be described in similar way with a 2 balls (atoms) that connected with a spring (the bond). The bond distance continually changes, but an equilibrium or average bond distance can be defined. Whenever the spring is stretched or compressed beyond this equilibrium distance, the potential energy of system increases. As the spring moves in a harmonic oscillation, the energy is proportional to the frequency of vibration which is determined by the force constant (K) of the spring and the masses of two bonded atoms. The natural frequency of vibration of a bond is given by the equation
which is derived from Hooke's Law for vibrating springs. The reduced mass, μ, of the system is given by
From those equations, two things should be noticeable immediately. One is that stronger bonds have a larger force constant K and vibrate at higher frequencies than weaker bonds. Therefore, triple bonds will vibrate at higher frequencies (higher wavenumber) than double bonds or single bonds.
The second is that bonds between atoms of higher masses vibrate at lower frequencies than bonds between lighter atoms as shown below.
Besides that, when a bond vibrates, not all modes of vibration are allowed. When vibration modes do not provides no dipole moment change, so it is not allowed; Only vibration modes give dipole moment change that is allowed. The result of unallowed vibration modes is there is no peak or signal in the spectra.
1-octyne (left) and 4-octyne (right)


Alkenes

Alkenes show many more peaks than alkanes. The principal peaks of diagnostic value are the C-H stretching peaks for the spcarbon at value greater than 3000 cm-1, along with C-H peaks for the spcarbon atoms. Also the C=C stretching peak near 1650 cm-1, with higher intensity of cis- than trans- configuration.
cis-pentene (above) and trans-pentene (below)

O-H and N-H stretching

The signals for O-H and N-H stretching occur around 3300 cm-1, but they look different. O-H stretching broad bands centering between 3400 and 3300 cm-1. In solution, it will also be possible to observe a free O-H stretching band at about 3600 cm-1 (sharp and weaker) to the left of the hydrogen bonded O-H peak.
1-butanol

Meanwhile, primary amines, R-NH2, show two N-H stretching bands in the range 3500-3300 cm-1, whereas secondary amines, R2N-H, show only one band in that region. Tertiary amines will not show an N-H stretch. Because of these features, it is easy to differentiate among primary, secondary, and tertiary amines by inspection of the N-H stretch region.
butylamine (above), dibutylamine (middle), and tributylamine (below)

Carbonyl stretching

The carbonyl group is present in aldehydes, ketones, acids, esters, amides, acid chlorides, and anhydrides. This group absorbs strongly in the range from 1850 to 1650 cm-1 because of its large change in dipole moment. In figure below provides the normal bas value for the C=O stretching vibrations of the various functional groups. The C=O frequency of a ketone, which is approximately in the middle of the range, is usually considered the reference point for comparison of these values. In this section we will focus on aldehydes, ketones, acids, and esters.
Normal base value for the C=O stretching vibrations for carbonyl groups
Aldehydes show a very strong band for the carbony group that appear in the range of 1740-1725 cm-1. A very important doublet can be observed in the C-H stretch regio for the aldehyde C-H near 2850 and 2750 cm-1. The presence of this doublet allows aldehydes to be distinguished from other carbonyl-containing compounds. In the other sides, ketones show a very strong band for C=O group that appears in the range of 1720-1708 cm-1.
Nonanal (left) and 2-nonanone (right)

Carboxylic acids show a very strong band for the C=O group that appears in the range of 1730-1700 cm-1 and the O-H stretch appears in the spectrum as a very broad band extending from 3400 - 2400 cm-1. This broad band centers on about 3000 cm-1 and partially obsecures the C-H stretching bands. If the very broad O-H stretch band is seen, along with a C=O peak, it almost certainly indicates the compound is a carboxylic acid.
Nonanoic acid
Besides, there are variations of carbonyl compounds that can shift the C=O stretch frequency. The first one, there is conjugation of C=O with C=C, it lowers the stretching frequency to around 1680 cm-1.
4-methyl pent-3-en-2-one (mesityl oxide)
The carbonyl amide absorbs at an even lower frequency, 1640-1680 cm-1, but the carbonyl ester absorbs at higher frequency, 1730 - 1740 cm-1.
Butyl propanoate (left) and N-butyl propanamide (right)

Besides that, carbonyl groups in small rings (5 carbons or less) absorb at an even higher frequency.
The C=O stretching vibrations for cyclic ketones

Carbon-Nitrogen Stretching

The C-N stretching absorbs around 1200 cm-1, and as the bond stronger the C=N stretch absorbs around 1660 cm-1 and is much stronger than the C=C absorption in the same region. The nitriles group absorb strongly just above 2200 cm-1. The alkyne C=Csignal is much weaker and is just below 2200 cm-1.
Octanenitrile

To summarise this section, we will see the approximation range of those signals in IR spectroscopy.
IR spectroscopy correlation chart

Carbon-13 NMR


Carbon-13 NMR (13C NMR or sometimes simply referred to as carbon NMR) is the application of nuclear magnetic resonance (NMR) spectroscopy to carbon. It is analogous to proton NMR (1H NMR) and allows the identification of carbon atoms in an organic moleculejust as proton NMR identifies hydrogen atoms. As such 13C NMR is an important tool in chemical structure elucidation in organic chemistry. 13C NMR detects only the 13C isotope of carbon, whose natural abundance is only 1.1%, because the main carbon isotope,12C, is not detectable by NMR since it has zero net spin.


Implementation

13C NMR has a number of complications that are not encountered in proton NMR. 13C NMR is much less sensitive to carbon than 1H NMR is to hydrogen since the major isotope of carbon, the 12C isotope, has a spin quantum number of zero and so is not magnetically active and therefore not detectable by NMR. Only the much less common 13C isotope, present naturally at 1.1% natural abundance, is magnetically active with a spin quantum number of 1/2 (like 1H) and therefore detectable by NMR. Therefore, only the few 13C nuclei present resonate in the magnetic field, although this can be overcome by isotopic enrichment of e.g. protein samples. In addition, thegyromagnetic ratio (6.728284 107 rad T−1 s−1) is only 1/4 that of 1H, further reducing the sensitivity. The overall receptivity of 13C is about 4 orders of magnitude lower than 1H.

[1]
Another potential complication results from the presence of large one bond J-coupling constants between carbon and hydrogen (typically from 100 to 250 Hz). In order to suppress these couplings, which would otherwise complicate the spectra and further reduce sensitivity, carbon NMR spectra are proton decoupled to remove the signal splitting. Couplings between carbons can be ignored due to the low natural abundance of 13C. Hence in contrast to typical proton NMR spectra which show multiplets for each proton position, carbon NMR spectra show a single peak for each chemically non-equivalent carbon atom.
In further contrast to 1H NMR, the intensities of the signals are not normally proportional to the number of equivalent 13C atoms and are instead strongly dependent on the number of surrounding spins (typically 1H). Spectra can be made more quantitative if necessary by allowing sufficient time for the nuclei to relax between repeat scans.


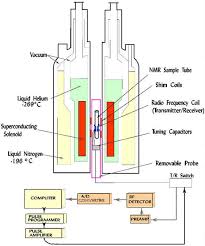
High field magnets with internal bores capable of accepting larger sample tubes (typically 10 mm in diameter for 13C NMR versus 5 mm for 1H NMR), the use of relaxation reagents,[2] for example Cr(acac)3 (chromium (III) acetylacetonate, CAS number 21679-31-2), and appropriate pulse sequences have reduced the time needed to acquire quantitative spectra and have made quantitative carbon-13 NMR a commonly used technique in many industrial labs. Applications range from quantification of drug purity to determination of the composition of high molecular weight synthetic polymers.
13C chemical shifts follow the same principles as those of 1H, although the typical range of chemical shifts is much larger than for 1H (by a factor of about 20). The chemical shift reference standard for 13C is the carbons in tetramethylsilane (TMS), whose chemical shift is considered to be 0.0 ppm.
Typical chemical shifts in 13C-NMR

DEPT spectra


DEPT spectra of propyl benzoate
DEPT stands for Distortionless Enhancement by Polarization Transfer. It is a very useful method for determining the presence of primary, secondary andtertiary carbon atoms. The DEPT experiment differentiates between CH, CH2and CH3 groups by variation of the selection angle parameter (the tip angle of the final 1H pulse):
  • 135° angle gives all CH and CH3 in a phase opposite to CH2
  • 90° angle gives only CH groups, the others being suppressed
  • 45° angle gives all carbons with attached protons (regardless of number) in phase

Signals from quaternary carbons and other carbons with no attached protons are always absent (due to the lack of attached protons).
The polarization transfer from 1H to 13C has the secondary advantage of increasing the sensitivity over the normal 13C spectrum (which has a modest enhancement from the NOE (Nuclear Overhauser Effect) due to the 1H decoupling).

APT spectra 

Another useful way of determining how many protons a carbon in a molecule is bonded to is to use an Attached Proton Test, which distinguishes between carbon atoms with even or odd number of attached hydrogens. A proper spin-echo sequence is able to distinguish between S, I2S and I1S, I3S spin systems: the first will appear as positive peaks in the spectrum, while the latter as negative peaks (pointing downwards), while retaining relative simplicity in the spectrum since it is still broadband proton decoupled.
Even though this technique does not distinguish fully between CHn groups, it is so easy and reliable that it is frequently employed as a first attempt to assign peaks in the spectrum and elucidate the structure.[3]

  1. ^ R. M. Silverstein, G. C. Bassler and T. C. Morrill (1991). Spectrometric Identification of Organic Compounds. Wiley.
  2. ^ Caytan, Elsa; Remaud, Gerald S.; Tenailleau, Eve; Akoka, Serge, GS; Tenailleau, E; Akoka, S (2007). "Precise and accurate quantitative 13C NMR with reduced experimental time". Talanta 71 (3): 1016–1021. doi:10.1016/j.talanta.2006.05.075. PMID 19071407
  3. ^ Keeler, James (2010). Understanding NMR Spectroscopy (2nd ed.). John Wiley & Sons. p. 457. ISBN 978-0-470-74608-0.


NMR Spectroscopy 1: The basics


NMR Spectroscopy 1: The basics

Hello everybody!
This morning, I struggled with NMR spectroscopy. I thought I understand the theory. However, when I was asked to draw a 1H NMR Spectrum of a molecule, I couldn't do it. I wonder what is the problem. So, I thought I put it write here.

Here how it's going to go. Firstly, I am going to write in my own word the theory behind NMR Spectroscopy. Secondly, I am going to confront my problem that is drawing NMR Spectrum of a molecule. Ultimately, I want to make sure that I understand all relevant information and I am able to make use of it for whatever objectives I want to achieve depending on the question.

Before I begin, I would like to share with you the question that I have been asked.

Structure of phenobarbitone. Source: Wikipedia
 Q: Draw the 1H NMR Spectrum you would expect for the drug molecule. Annotate clearly on the spectrum the chemical shift, integration information and splitting patterns you would expect. (5 marks)

OK. Let's begin.

Properties of nuclei.
One of the properties of nuclei is that it has nuclear spin. However, not all nuclei have it. Nuclear spin is quantized and has the symbol I. The exact number of different energy levels that a nucleus has depends on the value of I of that particular isotope. (For my purpose, we do not want to go deeper into this.) Just concentrate on 2 different nuclei that is 13C and 1H. Both have only 2 different energy levels.

NMR uses a strong magnetic field.

In an NMR instrument, there is a large supercooled magnet that provides external magnetic field. When a sample is put into the instrument, all nuclei which possess nuclear spin will be in their lowest energy state. For the case of 13C and 1H, they both have two different energy levels; one is aligned with the external magnetic field (therefore, lower energy level) and the other one is against the external magnetic field (therefore, higher energy level).

The difference between the two energy levels can be measured.

Nuclei that possess nuclear spin and be in their lowest energy state in an external field is said to interact with the magnetic field. The difference between the two energy levels can be measured (how it is done will be explained later). The difference is given as :
ΔE = hf where ΔE is the difference in energy, h is the planck constant (h = 6.62606957 × 10⁻³⁴ m2 kg / s ), and f is the frequency of the radio waves.
ΔE depends on:
  1. How strong the magnetic field is
  2. Magnetic properties of the nucleus itself
NMR uses radio waves to provide energy to flip nuclei from lower energy spin state to higher energy spin state.

Radio wave is in the frequency of 10^4 Hz to 10^8 Hz. The specificity of the spectrum is determined by the frequency of the radio waves i.e. each nuclei require certain frequency of radio waves to flip it from lower energy spin state to higher energy spin state.

The sample is irradiated with short pulse of radio waves of specific frequency. After irradiation, nuclei that is promoted to higher energy spin state will return to lower energy spin state. Energy is released as the nuclei fall back down and this energy can be measured.

Measurement obtained from NMR spectroscopy has to be Fourier transformed to obtained meaningful spectrum.

This is the confusing bit but since I am not an analytical chemist nor physical chemist, we can just accept the fact that the measurement of energy released has to be mathematically treated to produce typical NMR spectrum that we pharmacist can analysed.

The following diagram is an example of a typical NMR spectrum.
1H NMR spectrum of ethanol. Source: Wikipedia
At this moment, we are not going to interpret. I am just showing you the typical NMR spectrum. In reality, NMR spectrum is way more complicated than this and many research lab has been developing algorithm to improve the resolution (that is the ability to see each peak as distinct). We do not want to get deeper into this as this is for advanced study. I don't need it at the moment.

What kind of information does NMR Spectrum gives?
Fundamentally, NMR spectrum enables you to detect atomic nuclei and identify what environment it is in.

Several important information that you can gain from 1H NMR spectrum. (refer to the 1H NMR spectrum of ethanol for clarity)
  1. The number of peaks indicate the number of proton environment.
  2. The area under the peak or integration information tells you how many protons are there. Note: This information is in the form of ratio. In order to correctly identify how many protons are present, other techniques like Mass Spectroscopy should be used to precisely determine number of atoms in the molecule.
  3. The splitting pattern indicates the number of neighbouring nuclei that the nuclei interact with. Note that if the nuclei interact, they will have the same coupling constant. (usually written as J but it is not shown in this spectrum).
  4. Chemical shift tells you about the nature of the environment. This is the most difficult part of interpreting an NMR spectrum. However, we are going to go through this at some point in this post. Just wait for it.
Before we go through information in the NMR spectrum, I would like to first introduce you to chemical shift scale.

Chemical shift scale

The units for abscissa (or x-axis) is parts per million. Why is this the case? This is because the frequency of each nuclei environment depends on the strength of the external magnetic field. If the sample is run on a different NMR instrument or different strength of the magnetic field, the frequency at which that nuclei resonates will be different.
Before I continue, I would like to explain the meaning of the term resonates. In NMR spectroscopy, when nuclei is said to resonate it means that nuclei is absorbing energy from the radio waves so that it can be promoted to higher energy level spin state. As it falls down to lower energy level spin state, it releases energy which through several steps gives the NMR spectrum.
Hence, it will be difficult to say exactly where our signal is. Therefore, we defined our signal position by how far it is from a reference sample (tetramethylsilane is often used as reference), as a fraction of the operating frequency of the instrument.

Since the instrument usually has frequency of up to 900MHz and atomic nuclei resonates at frequency in Hz, it makes sense to use part per million. (Hz in MHz)

The ordinate represents relative amount of nuclei.

What gives each nuclei environment a distinct chemical shift?

Recall that we measure the energy released by nuclei as it falls down from higher energy level spin state to lower energy level spin state.
Each nuclei in a molecule resonate at different frequency. Why is this the case?
Logical deduction that we can make is is that the ΔE is difference for each nuclei. Recall that ΔE = hf.

Though the external magnetic field is constant for all nuclei, the magnetic field experienced by each nuclei is not exactly the same. .
Each nucleus is surrounded by electrons. In a magnetic field, electrons can generate tiny electrical current. Consequently, this electrical current will generate magnetic field.
Basic physics guys. Just to remind myself again. Suppose we have a wire and we coil it so that it forms a solenoid. When we pass current through it, magnetic field is generated.
This magnetic field which we will call local magnetic field will oppose the external magnetic field. Electron distribution around the nucleus vary for each environment. Two possible situations: shielding and deshielding.

When nucleus is protected by electrons around it, it is called shielding as the electrons shield the nucleus from external magnetic field. Consequently, the resonating frequency will shift upfield.
The vice versa is true. (More on this later.)

Take ethanol for example. I suggest you draw the structure in a piece of paper and follow my explanation. Oxygen atom is an electronegative atom which means in ethanol molecule electrons density will be higher towards the oxygen atom. As a result, proton attached to carbon next to oxygen atom will have less electron density hence deshielded. The nuclei will experience more external magnetic field i.e. greater energy difference. From ΔE = hf, we can infer that resonating frequency will also increase. Hence, the signal for CH2 is further downfield with regards to CH2 signal position without the oxygen atom.

I know things has become more difficult. Don't give up. You just need to get your head around it. I suggest you ensure that you understand everything up till this point. Read back from the beginning if necessary.

OK. Are you ready to continue?

Describing chemical shift.

If you find it difficult to follow the previous concept, I think one of the reason is that I haven't introduced the terminology to describe chemical shift.

First, I want to define chemical shift. Chemical shift is the resonating frequency with respect to standard as a fraction of frequency of instrument.

It's hard to explain the terminology without using a diagram. However, if you look into textbook of organic chemistry, you will find one.

When we are saying about the field i.e. magnetic field, we use downfield and upfield.
When we are saying about chemical shift, we use large or small.
When we are saying about frequency, we use high or low.
When we are saying about shielding, we use deshielded or shielded.

I think the best that I can do now is to give you example so that you understand.

So far, I would like to wrap up a few things before we continue.
Why each nuclei resonates at different frequency?

Each nuclei experience different magnetic field due to distribution of electrons around the nuclei leading to either shielding or deshielding.

What happens to resonating frequency when the nuclei is deshielded and vice versa?

Think about it this way. When a nucleus is deshielded, it experiences greater external magnetic field. Consequently, ΔE will increase. According to equation ΔE = hf, as ΔE increases, resonating frequency will also increase. Hence, the position of the signal will be further downfield.

OK. I think we are now ready to go to deeper.

Regions of the 1H NMR spectrum.

Many observations have been made and it is important to memorise the common proton environment.

Proton in:

CH3 = 1 ppm
CH2 = 2 ppm
CH = 3 ppm
Benzene = 7.2 ppm

Also, a diagram to help you remember the rough position of signal.

Our discussion on NMR spectroscopy has not finished. I am going to continue more on it tomorrow.

Thursday 15 October 2015

Multistep Flow Synthesis of 5-Amino-2-aryl-2H-[1,2,3]-triazole-4- carbonitrilesultistep Flow Synthesis of 5-Amino-2-aryl-2H-[1,2,3]-triazole-4- carbonitriles


Using the Uniqsis FlowSyn flow chemistry system researchers from the UCB Biopharma. Belgium have developed a flow synthesis of 2-substituted 1,2,3-triazoles that demonstrates improvements over the conventional batch route.
The route involves the diazotisation of anilines and condensation with malononitrile followed by the nucleophilic addition of ammonia or an alkylamine and finally a novel copper catalysed cyclisation. The intermediate azide was generated and consumed in situ which enabled safe scale up under the flow-through conditions employed.
DOI: 10.1002/chem.201402074

Multistep Flow Synthesis of 5-Amino-2-aryl-2H-[1,2,3]-triazole-4-carbonitriles

Authors, Dr. Jérôme Jacq, Dr. Patrick Pasau

Corresponding author
  1. UCB Biopharma, Avenue de l'Industrie, 1420 Braine l'Alleud (Belgium)
  • UCB Biopharma, Avenue de l'Industrie, 1420 Braine l'Alleud (Belgium)===
1,2,3-Triazole has become one of the most important heterocycles in contemporary medicinal chemistry. The development of the copper-catalyzed Huisgen cycloaddition has allowed the efficient synthesis of 1-substituted 1,2,3-triazoles. However, only a few methods are available for the selective preparation of 2-substituted 1,2,3-triazole isomers. In this context, we decided to develop an efficient flow synthesis for the preparation of various 2-aryl-1,2,3-triazoles. Our strategy involves a three-step synthesis under continuous-flow conditions that starts from the diazotization of anilines and subsequent reaction with malononitrile, followed by nucleophilic addition of amines, and finally employs a catalytic copper(II) cyclization. Potential safety hazards associated with the formation of reactive diazonium species have been addressed by inline quenching. The use of flow equipment allows reliable scale up processes with precise control of the reaction conditions. Synthesis of 2-substituted 1,2,3-triazoles has been achieved in good yields with excellent selectivities, thus providing a wide range of 1,2,3-triazoles.http://onlinelibrary.wiley.com/wol1/doi/10.1002/chem.201402074/full
http://onlinelibrary.wiley.com/store/10.1002/chem.201402074/asset/supinfo/chem_201402074_sm_miscellaneous_information.pdf?v=1&s=77c885224607254b0d594d6cd190e655dd4ac7ee
NMR2002
1H/13c NMR OF 1a
NMR1000
NMR1001

NMR1004
NMR1005

NMR1006

NMR1007
UCB Biopharma,  Belgium


Uniqsis FlowSyn


Uniqsis Ltd
29 Station Road
Shepreth
Cambridgeshire
SG8 6GB
UK
Telephone
+44 (0)845 864 7747
Email
info@uniqsis.com

Map of cambridgeshire


Halifax survey names South Cambridgeshire as best place to live in rural Britain


///////////FLOW SYNTHESIS, UCB Biopharma, Belgium, Uniqsis FlowSyn


Mumbai Foods

10 Best Regional Foods you must Try in Mumbai!


1. The Street Food

10 Best Regional Foods you must Try
From Paav Bhaji, Vada Paav, potato and onion Bhajias, Bombay sandwiches, street-sideDosas, Patti Samosas, Pani Puri, Sev Puri, Dahi Puri, Ragda Pattis, boiled Channa Chaat,Kala Khatta, raw mango slices and berries in Chinese Bhel Indian-style pizzas heaped with cheese to fresh fruit accompanied by real dairy cream that is rare to find in most places. This is a gastronomes delight. As layers of flavours, textures, colours create dishes that pop in your mouth and hardly impact your pocket, it maybe fun to play a guessing game of what came from where and how it may have transformed here.
Where – In South Mumbai, Girgaum Chowpatty snack shops, Bachelors for shakes, Indian style pizzas and sandwiches, and Homji Street Khao Galli (Fort) offer a spectrum of street food. Cannon (near CST) and Sardar (Tardeo) are famous for Pao Bhaji, Gurukrupa (Sion) for Samosa Ragda and Haj Ali Juice Centre for fresh juices, fruit cream, sandwiches and Indian style pizzas.

2. A Konkani Coastal Meal


10 Best Regional Foods you must Try
The Konkan coast starts from Mumbai and goes on till Goa. Malvani cuisine is marked by the use of garam masala and red chilli. On the other hand, Gomantak cuisine is the coastal cuisine of areas in and around Goa and is marked by the generous use of fresh coconut and kokum. In most Mumbai restaurants, you’ll find a mix of Malvani and Gomatak cuisines. The curries here are tangy, coconut-y, fiery with spice and red chilli and accompanied by rice as the primary starch. Eat the catch of the day in a coconut-y curry poured over a heap of steaming white rice or mop them up with the variety of breads unique to this coast.

Where – Satkar (near Goregaon station) for Malvani, Highway Gomantak (on the Western Express Highway, Bandra East) and Goa House (Juhu), Singhudurg and Pradeep Gomatak (Fort).

3. A Typical Vegetarian Maharashtrian Meal

10 Best Regional Foods you must Try
The star attractions that really pull crowds are snacks like Thaali Peeth (a sort of a multigrain pancake or flatbread), Kandha Pohe (flattened rice snack), Sabudana Vada(sago and potato fritter flecked with roasted peanuts), Misal Paav (a fiery curry made of pulses and fried nothings served with bun), Kothimbir Vadi (coriander leaf and gram flour fritters) etc. Aamras (fresh mango puree) when in season and Kharwas (a jelly like milky pudding made from the milk of a cow that has just given birth) round off the meal perfectly.
Where: Aaswad (opposite Sena Bhavan in Dadar) and Prakash (Dadar) though Vinay Health Home (Charni Road) comes highly recommended as well.

4. A South Indian Meal

10 Best Regional Foods you must Try
The saga of Udupi cuisine began in this city when Rama Nayak arrived from Karnataka, in the 1940s. In Matunga, the area where a lot of South Indians lived, he set up his establishment near the King Circle railway station, and started cooking and serving authentic Udupi food on plantain leaves. This was Mumbai’s humble initiation into the idli-dosai menu. Soon Rama Nayak quadrupled his outlets into restaurants that are still known for great, uncompromising South Indian food in the city. Meanwhile, many other similar stories resulted in Udupi and Udupi-esque restaurants that cropped up all over the city, to be the primary dining room for the hungry working class of Mumbai.

Where: Most Udupi style restaurants have gotten Mumbaified in their offerings but there still are a few in Matunga like Ramanayaks Udupi (the thaali is what this place is most famous for), Udupi Idli House (absolutely fantastic range of idlis, chutneys and unlimitedsambhar), Café Madras (recommend almost everything here but the Podi Upma and Ragi Dosa are favourites), Ramashray (great idlis and dosas) and Manis Lunch Home (known for the thaalis).

5. Bori Mohalla Food Trail

10 Best Regional Foods you must Try
It is said that Bohris are a Muslim business community who came from Gujarat and made great inroads into trade and commerce. The Muslim eat street of Mumbai, offers a cuisine distinct from other Mughal/Muslim cuisines of the country. While Mohammed Ali Road is famous for the food it offers for Iftar during Ramzan, Bohri Mohallah is the hidden gem of Mumbai that comes alive at dusk everyday, just as the evening prayers are being said at the Saifee mosque near by. In these gallis you will discover unique dishes of the Memon and Dawoodi Bohra inspired from regions as diverse as Surat, Delhi, Lucknow to United Kingdom, Malaysia, Iran, China and Yemen. Every kind of meat imaginable is on offer, cooked in myriad ways, served up as kebabs or in rich gravies. Breads range from naan to khamiri to fried paranthas and the murtabak like Baida Roti.

Where: Savoury – Sarvii Valibhai Payawal, Surti 12 Handi (Handi), Noor Mohamadi Hotel (Chicken Sanju Baba, the recipe for which was allegedly given to the hotel by Sanjay Dutt), Indian Hotel (kebabs and rolls), Mohammed Kareem Chana Masale Wala (Channa Masala).

6. An Irani Cafe for a Parsi Meal

10 Best Regional Foods you must Try
Irani cafes (Iranis were the second batch of Zoroastrians to come to India from Persia) today offer simple menus with signature Parsi dishes including Salli Boti (a fantastic dish of melting mutton in a beautifully caramalised gravy, topped with crunchy fried potato straws), Mutton Dhansak (meat cooked in a creamy gravy of lentils and spices), Kheema Ghotala (curried minced mutton with an egg scrambled in, served with paav for breakfast) all to be washed down with the syrupy raspberry soda.

Where: Kyani (near Metro cinema) and Yazdani Bakery, Ideal Corner, Jimmy Boy (try their new Parsi Wedding feast), Military Cafe (all in Fort), Britannia (personally, I am of the opinion that the Berry Pulav is hyped but it certainly has great appeal and the berries themselves are a lovely tart-sweet payoff). In the suburbs, I would highly recommend theSalli Boti at Ashmit’s Snack Shack (Bandra, Pali Junction).

7. A Mangalorean Meal

10 Best Regional Foods you must Try
The food along the west coast of India is a continuum of gradually  transforming flavours. As you reach Mangalore things start to get more meaty. The seafood and meat gravies including Ghassi (the most famous gravy of this region) are served up with the silky gossamer like Neer Dosa (thin rice pancakes). The coconut laden Sukkapreparations of mutton, squid or clams make for another brilliant combination with the soft Neer Dosas. Chicken Roti, another specialty of Mangalore is an intriguing dish of chicken curry with a roasted coconut gravy, served over crisp rice cracker ‘Kori Roti‘ that softens into a dosa on soaking up the chicken gravy.

Where: Apoorva (Fort) and Pratap Lunch Home (Fort) offer fantastic home-style food while Trishna (Fort) and Mahesh (Fort and Juhu) are more famous high end ones; great if you want to try crabs, jumbo prawns, lobster and pomfret in a tandoori masala or International sauces.

8. A Modern American/International Meal

10 Best Regional Foods you must Try
An experience of Mumbai food would be incomplete without including the modern American/Continental, trendy, upmarket but just about affordable restaurants that have cropped up all over the city. A trend spearheaded by the enduring Indigo Restaurant and Deli which has become an institution in itself, these restaurants are rapidly increasing in number, available now in almost every mall as well as peppered around major office areas.

Where: Indigo Deli branches around the city, Indigo Restaurant (Colaba) broke new ground a decade ago in offering five star quality contemporary international food at relatively affordable prices in restaurants around the city.

9. Mumbai’s Old School Bars

10 Best Regional Foods you must Try
While Mumbai, like other Indian cities has its share of international food to offer, your experience would be incomplete without a mention of its age old bars that attract tourists and city dwellers as much or maybe more for their ambiance and location as for the food. The food is a mix of ‘continental’ (Indianised grills, steaks, burgers, sandwiches, pastas) with the essential North Indian and Chinese thrown in for good measure. The colonial Parsi cafe meets old school 80’s pub meets dingy, overcrowded street-side restaurant ambiance of the ones in South Mumbai makes these almost into a right of passage for city new comers and college students.

Where: Leopold, Café Mondegar and Café Churchill all flank the Taj Mahal Hotel in Colaba. Totos Garage and Janata Bar are both in Bandra.

10. Regional Bests

10 Best Regional Foods you must Try
If you want to try seriously authentic versions of cuisines from parts of the country you have never been to before, the city does offer a few restaurants that just about manage to escape Mumbaification.
Where: Head to Bhojohori Manna (Oshiwara) for superlative home-style Bengali food, Punjab Grill (Juhu or Phoenix Mills) for fantastically authentic Punjabi fare. Soam (Girgaum) and Hiralal Kashidas (Girgaon) make fantastic Gujarati Undhiyo when the season is right. Deluxe (Fort) and Just Kerala (Andheri East) are known for their non-vegetarian Kerala meal, Chetna (Fort) for its Rajasthani thali and Maharaja Bhog (Goregaon, Inorbit Mall) for a Gujarati and Rajasthani melange.


/////////