DR ANTHONY MELVIN CRASTO,WorldDrugTracker, helping millions, A 90 % paralysed man in action for you, I am suffering from transverse mylitis and bound to a wheel chair, With death on the horizon, nothing will not stop me except God................DR ANTHONY MELVIN CRASTO Ph.D ( ICT, Mumbai) , INDIA 25Yrs Exp. in the feld of Organic Chemistry,Working for GLENMARK GENERICS at Navi Mumbai, INDIA. Serving chemists around the world. Helping them with websites on Chemistry.Million hits on google, world acclamation from industry, academia, drug authorities for websites, blogs and educational contribution

Sunday, 23 August 2015

Triterpenoid saponins from the roots of Acanthophyllum gypsophiloides Regel

.


 ABSRACT


 Two new triterpenoid saponins 1 and 2 were isolated from the methanol extract of the roots of Acanthophyllum gypsophiloides Regel. These saponins have quillaic acid or gypsogenin moieties as an aglycon, and both bear similar sets of two oligosaccharide chains, which are 3-O-linked to the triterpenoid part trisaccharide α-L-Arap-(1→3)-[α-D-Galp-(1→2)]-β-D-GlcpA and pentasaccharide β-D-Xylp-(1→3)-β-D-Xylp-(1→3)-α-L-Rhap-(1→2)-[β-D-Quip-(1→4)]-β-D-Fucp connected through an ester linkage to C-28. The structures of the obtained saponins were elucidated by a combination of mass spectrometry and 2D NMR spectroscopy. A study of acute toxicity, hemolytic, anti-inflammatory, immunoadjuvant and antifungal activity was carried out. Both saponins 1 and 2 were shown to exhibit immunoadjuvant properties within the vaccine composition with keyhole limpet hemocyanin-based immunogen. The availability of saponins 1 and 2 as individual pure compounds from the extract of the roots of A. gypsophiloides makes it a prospective source of immunoactive agents.


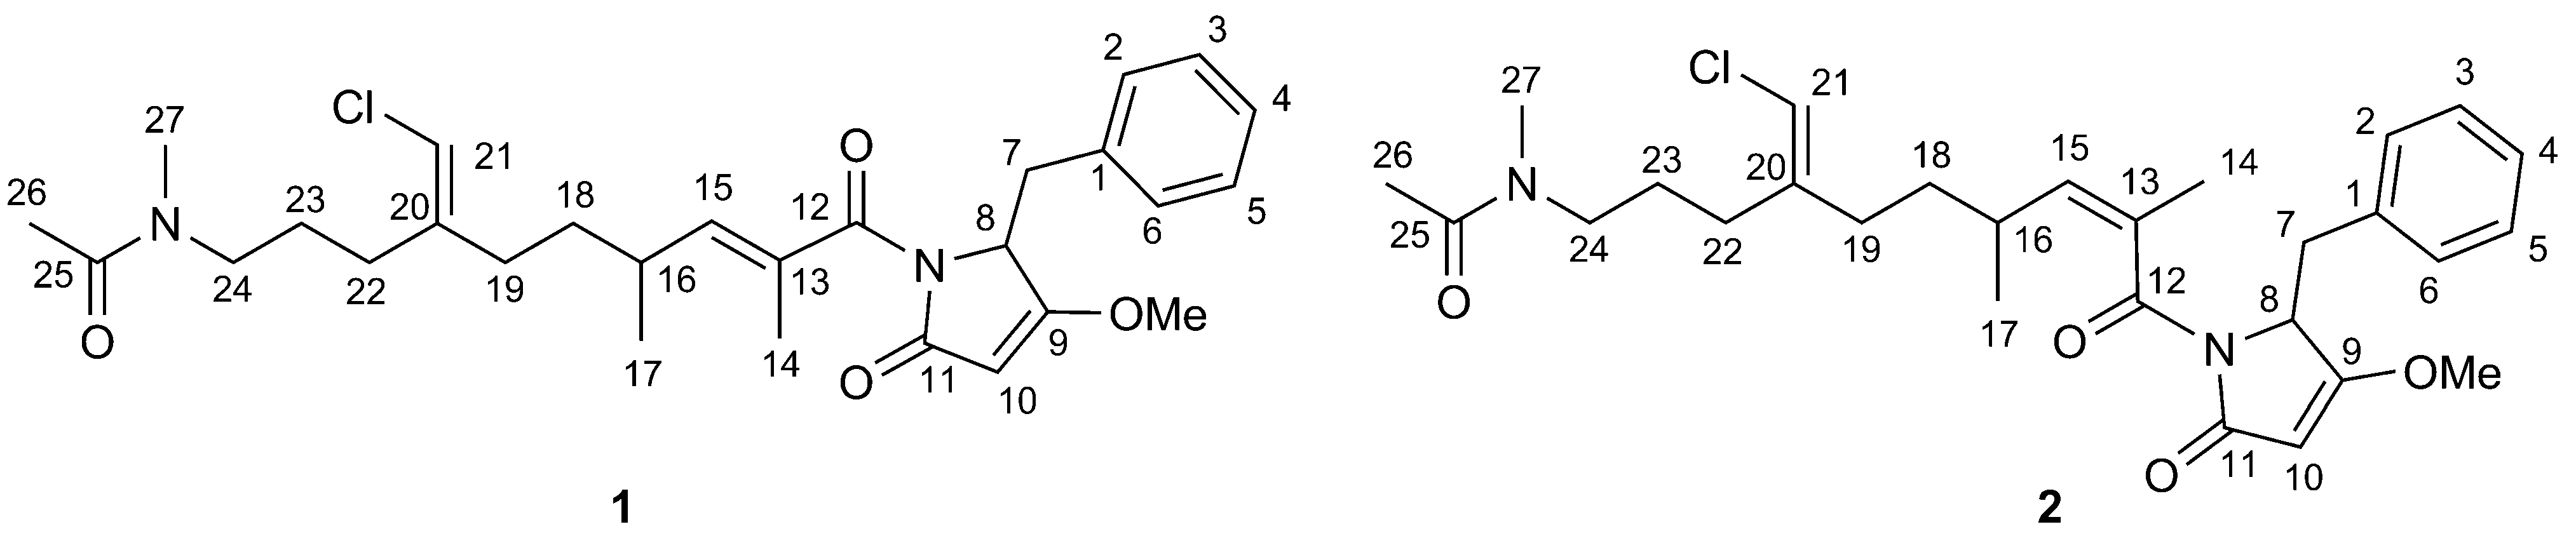
The methanolic extract of the dried powdered roots of A. gypsophiloides was concentrated, and the crude mixture of saponins was precipitated from methanol by the addition of acetone and subjected to reversed-phase С18 HPLC. Compounds 1 and 2 (Figure 1) were isolated as white amorphous powders. Compound 1 exhibited in the HRMS (ESI) the [M + Na]+ peak at m/z 1681.7071, indicating a molecular weight compatible with the molecular formula C75H118O40. Compound 2 exhibited the [M + Na]+ peak at m/z 1665.7181, consistent with the molecular formula С75H118O39. GLC analysis of the acetylated (S)-2-octyl glycosides derived after full acid hydrolysis of compound 1 revealed the presence of D-galactose (D-Gal), L-arabinose (L-Ara), 6-deoxy-D-glucose (D-Qui), D-xylose (D-Xyl), L-rhamnose (L-Rha), D-fucose (D-Fuc), and D-glucuronic acid (D-GlcA). Similar investigation of compound 2 revealed the same sugar composition as for compound 1.
[1860-5397-8-87-1]
Figure 1: Saponins from A. gypsophiloides 1, R = OH and 2, R = H.
The structures of both compounds 1 and 2 were confirmed on the basis of their 1H NMR, 13C NMR, APT, COSY, TOCSY, ROESY, HSQC, and HMBC spectra. In accordance with the earlier reports [18] on structures of saponins from A. gypsophiloides, the aglycons of compound 1 and 2 were supposed to comprise quillaic acid (16-α-hydroxygypsogenin) and gypsogenin, respectively. This assumption was in good agreement with the detection of characteristic signals for six methyl groups in the 1H (Table 1) and 13C NMR (Table 2) spectra of 1 and 2. Furthermore, the presence of these aglycons was unambiguously confirmed by the good agreement between 13C NMR shifts of aglycon moieties of 1 and 2 and signals of aglycons for described bidesmosides comprising quillaic acid [21] and gypsogenin [21].
Table 1: 1H and 13С NMR data (δ, ppm) of the triterpene units of compounds 1 and 2 (500 MHz, pyridine-d5/D2O 1:1).a
Comp.C-1C-2C-3C-4C-5C-6C-7C-8C-9C-10C-11C-12C-13C-14C-15
H-1H-2H-3 H-5H-6H-7 H-9 H-11H-12  H-15

138.325.285.355.948.320.732.840.447.036.323.9122.7144.142.235.9
 1.532.284.06 1.371.401.62 1.75 1.915.37  2.04
 0.911.97   1.011.49   1.86   1.89
238.225.185.456.048.220.832.640.247.836.323.8122.8144.142.528.7
 1.512.294.10 1.431.431.62 1.66 1.875.37  1.81
 0.941.97   1.081.48   1.82   1.42

Comp.C-16C-17C-18C-19C-20C-21C-22C-23C-24C-25C-26C-27C-28C-29C-30
 H-16 H-18H-19 H-21H-22H-23H-24H-25H-26H-27 H-29H-30

173.947.941.647.429.335.831.5211.610.716.017.627.3177.133.124.6
 5.01 3.272.57 2.192.289.711.430.880.961.68 0.940.96
    1.24 1.262.04        
223.347.942.146.430.833.932.4211.510.715.817.526.1176.433.223.7
 2.05 2.991.68 1.251.829.631.430.850.921.24 0.930.85
 1.75  1.17 1.141.66        
Table 2: 1H and 13С NMR data (δ, ppm; J, Hz) for carbohydrate units of compounds 1 and 2 (500 MHz, pyridine-d5/D2O 1:1).
Units, atoms12


 δCδH (J)δCδH (J)

→2,3)-GlcA (a)    
1103.44.83, d (7.8)103.44.82, d (7.3)
277.74.2677.74.27
385.04.3085.04.31
471.64.1671.64.17
577.74.2677.74.27
6175.2 175.2 

Gal (b)    
1103.25.33, d (7.7)103.25.33, d (7.5)
272.84.1472.84.14
374.44.0974.54.08
470.34.3170.34.31
576.53.9776.53.97
6(a, b)62.24.33, 4.1762.14.35, 4.17

Ara (c)    
1104.05.16, d (7.5)104.05.17, d (7.5)
272.44.2372.44.23
373.74.1273.84.12
469.34.2869.44.28
5(a, b)67.24.34, 3.9567.24.34, 3.95

→2,4)-Fuc (d)    
194.45.78, d (8.1)94.55.80, d (8.1)
274.64.4375.14.41
376.34.2076.04.19
483.24.1283.04.12
571.94.0371.84.02
617.11.5217.11.52

Qui (e)    
1105.64.92, d (7.8)105.64.92, d (7.8)
275.63.8175.63.80
377.03.9977.14.00
476.13.5376.13.53
572.93.6972.93.70
618.21.5118.21.51

→4)-Rha (f)    
1101.26.01 s (<1)101.25.97 s (<1)
271.14.6271.14.62
371.84.4171.84.43
483.74.1583.74.18
568.34.2668.74.28
618.31.6518.41.68

→3)-Xyl (g)    
1106.15.06, d (8.5)105.95.09, d (7.7)
274.73.9274.73.91
386.54.0286.44.01
468.83.9968.84.00
5(a, b)66.24.18, 3.5866.24.18, 3.58

Xyl (h)    
1104.95.03, d (8.8)104.95.04, d (7.6)
274.73.9274.73.91
377.04.0177.14.01
470.24.0970.24.09
5(a, b)66.54.30, 3.6966.54.30, 3.68
Analysis of COSY and TOCSY spectra of both 1 and 2 revealed the presence of the following residues: β-GlcpA (residue a), β-Galp (residue b), α-Arap (residue c), β-Fucp (residue d), β-Quip (6-deoxy-β-Glcp, residue e), α-Rhap (residue f), β-Xylp (residues g and h). The HSQC spectrum confirmed the structures of the triterpene aglycon and showed the positions of the substitutions within the oligosaccharide fragments (Table 1 and Table 2). The ROESY spectra (identical for compounds 1 and 2) disclosed the sequence of the residues in two oligosaccharides and their location at the C-3 and C-28 of the aglycon. Thus, the location of GlcA (residue a) at the position 3 of the triterpene was established from the presence of a correlation peak 1a/3Agl (Figure 2 and Figure 3). Correlation peaks 1b/2a and 1c/3a correspond to substitutions of the residue a by terminal b at the position 2 and by terminal c at the position 3. Esterification of the position 1 of Fuc (residue d) with the carboxy group of the triterpene was unambiguously shown by the high-field shift of C-1 (94.4 ppm), being indirectly confirmed with the long-range correlation peak in the ROESY spectra 16Agl/3d. The sequence of the other residues was disclosed from the presence of the correlation peaks 1e/4d, 1f/2d, 1g/4f and 1g/4h (Figure 2). HMBC spectra finally confirmed the structure of the aglycons and the sequence of the residues. Thus, the correlation peak 1d/28Agl evidenced the location of Fuc (residue d) as the esterified substituent at C-28 of the triterpene (Figure 4). The other inter-residue correlation peaks were in agreement with the structure of oligosaccharides established from analysis of the ROESY spectra.
[1860-5397-8-87-2]
Figure 2: Part of a 2D ROESY spectrum of compound 1. The corresponding parts of the 1H NMR spectrum are shown along the axes. Arabic numerals refer to atoms in sugar residues denoted by letters, as shown for compounds 1 and 2. Slashes are used for the designation of inter-residual interactions.
[1860-5397-8-87-3]
Figure 3: Key ROESY (dashed line) correlations for compound 1.
[1860-5397-8-87-4]
Figure 4: Part of the HMBC spectrum of compound 1. 1H and 13C NMR spectra are shown along the horizontal and vertical axes, respectively. Arabic numerals before a slash refer to protons and after a slash refer to carbons in sugar residues denoted by letters, as shown for compounds 1 and 2.
Characteristic chemical shifts in the 13C NMR spectrum of 2C 85.4 ppm for C-3 and δC 176.4 ppm for C-28 of the aglycon) evidence the bidesmosidic nature of the genin, which is glycosydated at C-3 and esterified to an oligosaccharide. The structures of both the trisaccharide and pentasaccharide fragments of compound 2 are similar to those established for compound 1. Thus the structure of 2 was elucidated as gypsogenin 28-O-β-D-xylopyranosyl-(13)-β-D-xylopyranosyl-(13)-α-L-rhamnopyranosyl-(12)-[6-deoxy-β-D-glucopyranosyl-(14)]-β-D-fucopyranosyl ester 3-O-α-L-arabinopyranosyl-(13)-[β-D-galactopyranosyl-(12)]-β-D-glucuronopyranoside.

Triterpenoid saponins from the roots of Acanthophyllum gypsophiloides Regel

Elena A. Khatuntseva1, Vladimir M. Men’shov1, Alexander S. Shashkov2, Yury E. Tsvetkov1, Rodion N. Stepanenko3, Raymonda Ya. Vlasenko3, Elvira E. Shults4, Genrikh A. Tolstikov4, Tatjana G. Tolstikova4, Dimitri S. Baev4, Vasiliy A. Kaledin5, Nelli A. Popova5, Valeriy P. Nikolin5, Pavel P. Laktionov6, Anna V. Cherepanova6, Tatiana V. Kulakovskaya7, Ekaterina V. Kulakovskaya7 and Nikolay E. Nifantiev1Email of corresponding author
1Laboratory of Glycoconjugate Chemistry, N. D. Zelinsky Institute of Organic Chemistry, Russian Academy of Sciences, Leninsky prospect 47, 119991 Moscow, Russian Federation
2Laboratory of NMR spectroscopy, N. D. Zelinsky Institute of Organic Chemistry, Russian Academy of Sciences, Leninsky prospect 47, 119991 Moscow, Russian Federation
3Institute of Immunology, Ministry of Health and Social Development of Russian Federation, Kashirskoe Chausseе, 24/2, 115478 Moscow, Russian Federation
4Laboratory of Pharmacological Researches N. N. Vorozhtsov Novosibirsk Institute of Organic Chemistry, Siberian Branch of the Russian Academy of Sciences, prospect Acad. Lavrent’eva, 9, 630090 Novosibirsk, Russian Federation
5Institute of Cytology and Genetics Siberian Branch of the Russian Academy of Sciences, 10 prospect Acad. Lavrent’eva, 630090 Novosibirsk, Russian Federation
6Institute of Chemical Biology and Fundamental Medicine, Siberian Branch of the Russian Academy of Sciences, 8 prospect Acad. Lavrent’eva, 630090 Novosibirsk, Russian Federation
7G. K. Skryabin Institute of Biochemistry and Physiology of Microorganisms, Russian Academy of Sciences, 142290 Pushchino, Moscow region, Russian Federation
Email of corresponding author Corresponding author email     
This article is part of the Thematic Series "Synthesis in the glycosciences II".
Guest Editor: T. K. Lindhorst
Beilstein J. Org. Chem. 2012, 8, 763–775.
 http://www.beilstein-journals.org/bjoc/single/articleFullText.htm?publicId=1860-5397-8-87
//////

Smenamides A and B

.


Figure 1. Structures of smenamide A (1) and B (2).
Marinedrugs 11 04451 g001 1024


 Smenamide A (1)
 The positive ion mode high-resolution ESI mass spectrum of smenamide A (1)  displayed [M + H]+ and [M + Na]+ pseudomolecular ion peak at m/z 501.2508 and 523.2326, respectively. Both ions showed intense (32%) M + 2 isotope peaks, suggesting the presence of one atom of chlorine, and were indicative of the molecular formula C28H37ClN2O4 (calcd. 501.2515 for C28H38ClN2O4 and 523.2334 for C28H37ClN2O4Na). The peak at m/z 487.2557 ([M − HCl + Na]+) in the HRMS/MS spectrum confirmed the presence of chlorine in the molecule.


 Table 1. NMR data of smenamide A (1) (700 MHz, CD3OD).
Click here to display table


Smenamide A (1)

Colorless amorphous solid, HRESIMS (positive ion mode, MeOH) m/z 523.2326 ([M + Na]+, C28H37ClN2O4Na+, calcd. 532.2334), m/z 501.2509 ([M + Na]+, C28H38ClN2O4+, calcd. 501.2515); MS isotope pattern: M (100%), M + 1 (32%, calcd. 31.5%), M + 2 (37%, calcd. 36.0%), M + 3 (10%, calcd. 10.6%,); HRESIMS/MS (parent ion m/z 523.23, C28H37ClN2O4Na+): m/z 487.2557 (C28H36N2O4Na+, calcd. 487.2567), 397.2092 (C21H30N2O4Na+, calcd. 397.2098), 320.1384 (C16H24ClNO2Na+, calcd. 320.1388), 284.1618 (C16H23NO2Na+, calcd. 284.1621), 244.0941 (C12H15NO3Na+, calcd. 244.0944), 226.0836 (C12H13NO2Na+, calcd. 226.0838), 202.0472 (C9H9NO3Na+, calcd. 226.0475); 1H and 13C NMR: Table 1; UV (MeOH): λmax(ε) 287 nm (8200), 246 nm (46000), 225 nm (92000); CD (MeOH): λmax(Δε) 238 (+33), 219 (−30).


Smenamide B (2)

Colorless amorphous solid, HRESIMS (positive ion mode, MeOH) m/z 523.2320 ([M + Na]+, calcd. for C28H37ClN2O4Na+ 532.2334), m/z 501.2505 ([M + Na]+, calcd. for C28H38ClN2O4+ 501.2515); MS isotope pattern: M (100%), M + 1 (31%, calcd. 31.5%), M + 2 (36%, calcd. 36.0%), M + 3 (11%, calcd. 10.6%,); HRESIMS/MS (parent ion m/z 523.23, C28H37ClN2O4Na+): m/z 487.25567 (C28H36N2O4Na+, calcd. 487.2567), 397.2091 (C21H30N2O4Na+, calcd. 397.2098), 320.1383 (C16H24ClNO2Na+, calcd. 320.1388), 284.1617 (C16H23NO2Na+, calcd. 284.1621), 244.0941 (C12H15NO3Na+, calcd. 244.0944), 226.0835 (C12H13NO2Na+, calcd. 226.0838), 202.0471 (C9H9NO3Na+, calcd. 226.0475); 1H and 13C NMR: Table 1; 1H and 13C NMR: Supplementary Table S1; UV (MeOH): λmax(ε) 287 nm (15000), 248 nm (42000), 225 nm (84000); CD (MeOH): λmax(Δε) 237 (+7.3).


Mar. Drugs 2013, 11(11), 4451-4463; doi:10.3390/md11114451
Smenamides A and B, Chlorinated Peptide/Polyketide Hybrids Containing a Dolapyrrolidinone Unit from the Caribbean Sponge Smenospongia aurea. Evaluation of Their Role as Leads in Antitumor Drug Research
Roberta Teta 1, Elena Irollo 2, Gerardo Della Sala 1, Giuseppe Pirozzi 2, Alfonso Mangoni 1 and Valeria Costantino 1,*
1The NeaNat Group, Dipartimento di Farmacia, Università degli Studi di Napoli Federico II, via D. Montesano 49, Napoli 80131, Italy; E-Mails: roberta.teta@unina.it (R.T.); gerardo.dellasala@unina.it (G.S.); alfonso.mangoni@unina.it (A.M.)
2Department of Experimental Oncology, Istituto Nazionale Tumori Fondazione “G. Pascale”, Via M. Semmola, Napoli 80131, Italy; E-Mails: e.irollo@istitutotumori.na.it (E.I.); g.pirozzi@istitutotumori.na.it (G.P.)
*Author to whom correspondence should be addressed; E-Mail: valeria.costantino@unina.it; Tel.: +39-081-678-504; Fax: +39-081-678-552.
Received: 27 September 2013; in revised form: 25 October 2013 / Accepted: 25 October 2013 /
Published: 8 November 2013

Abstract

: An in-depth study of the secondary metabolites contained in the Caribbean sponge Smenospongia aurea led to the isolation of smenamide A (1) and B (2), hybrid peptide/polyketide compounds containing a dolapyrrolidinone unit. Their structures were elucidated using high-resolution ESI-MS/MS and homo- and heteronuclear 2D NMR experiments. Structures of smenamides suggested that they are products of the cyanobacterial metabolism, and 16S rRNA metagenomic analysis detected Synechococcus spongiarum as the only cyanobacterium present in S. aurea. Smenamides showed potent cytotoxic activity at nanomolar levels on lung cancer Calu-1 cells, which for compound 1 is exerted through a clear pro-apoptotic mechanism. This makes smenamides promising leads for antitumor drug design.

//////

MENTHOL

.

 SPECTRA
 

Sample: menthol
Solvent: CDCl3
Spectrometer: AVANCE 500
Probehead: Inverse Broadband with z-Gradients


Experiment: 2D 1,1-Multiplicity-edited ADEQUATE
Details: AVANCE Tutorial
Pulse program: adeqed11etgpsp
Experiment Time: 4 hours
PARAMETERS
ACQUISITION PROCESSING
2 td=1k
1 td=128w
ns=256
xfb followed by phase correction in both dimensions
2 si=1k
1 si=256w
RELATED ITEMS
 
OBSERVATIONS
Improved sensitivity is achieved increasing the number of scans. On the other hand, better resolution in the indirect F1 dimension can be achieved by increasing the number of fids to be acquired (1 td) or using linear prediction when processing (MEM=LPfr).


 SPECTRA
 

Sample: menthol
Solvent: CDCl3
Spectrometer: AVANCE 500
Probehead: Inverse Broadband with z-Gradients


Experiment: 2D 1,1-Multiplicity-edited refocused-ADEQUATE
Details: AVANCE Tutorial
Pulse program: adeqed11etgprdsp
Experiment Time: 4 hours
PARAMETERS
ACQUISITION PROCESSING
2 td=1k
1 td=128w
ns=256
xfb followed by phase correction in both dimensions
2 si=1k
1 si=256w
RELATED ITEMS
 
OBSERVATIONS
Improved sensitivity is achieved increasing the number of scans. On the other hand, better resolution in the indirect F1 dimension can be achieved by increasing the number of fids to be acquired (1 td) or using linear prediction when processing (MEM=LPfr).


//////

Proton NMR in Chiral Liquid Crystals

.


Proton NMR in Chiral Liquid Crystals

 Nuclear Magnetic Resonance is a particularly well suited tool to study molecules which are dissolved in liquid crystals (1) : whereas intermolecular interactions from the spin Hamiltonian are averaged to zero by the translational and rotational diffusion of organic molecules from the mesophase, anisotropic intramolecular interactions are only partially averaged by molecular dynamics and, in the case of a uniaxial phase, reduced to a single – order sensitive – value for every molecule in the sample.(2).
 
de

 These anisotropic measurements (mainly dipolar or quadrupolar couplings, or even chemical shift anisotropy which is weaker) have been successfully used to probe both the structure and the dynamics of molecules solvated in liquid crystals, and have notably led to the quantization of the difference in orientation between enantiomers diluted in a chiral liquid crystal, which results from diastereomeric interactions between the solute and the anisotropic solvent : the best results so far have been obtained using a lyotropic liquid crystal composed of poly-(γ-benzyl)-L-glutamate (PBLG) dissolved in various -non denaturing- organic solvents. This chiral differentiation process can be monitored through either 2H - {1H}, 13C - {1H}, 1H coupled 13C, or even natural abundance 2H - {1H} NMR spectra.(3-6)
 
de

 However, because of numerous long-range dipolar couplings, proton spectra of enantiomers, though resulting from the most sensitive experiments, are usually overcrowded, and coupling fine structures are generally not resolved, which makes proton NMR useless as such in that field.
 In this context, our group has been working for years now on the simplification of the proton spectra of enaniomeric mixtures dissolved in chiral, liquid crystalline solvents. Below are presented some applications of our latest developments that have led to a simplification - and an acceleration - of the analysis of such data.
 

Application of SERF Spectroscopy to the Visualization of Enantiomers

 Our group is studying in what extent it is possible to simplify proton spectra, and enhance their resolution, to a point where the accurate measurement of enantiomeric excesses is reachable. We have shown how the use of homonuclear selective refocusing 2D NMR experiments (SERF), which was initially developed by Fäcke and Berger (7), and extensively studied since then, allows us to extract the coupling between proton spins at given resonance frequencies, out of their whole coupling network, in small chiral organic compounds. (8).
 
de

 We show that it is possible to apply this approach to oriented samples, and increase the quality of the resulting spectra by optimizing the selective excitation and refocusing pulses, as well as the phase and gradient cyclings of this SERFph pulse sequence. (9)

Spin-Spin Coupling Edition in Chiral Liquid Crystal NMR Solvent

 We have applied the concept of a sample spatial frequency encoding to the analysis of enantiomeric mixtures dissolved in a chiral liquid crystal. We have run a G-SERFph (for phaseable Gradient encoded homonuclear SElective ReFocusing spectroscopy) experiment(10) on a model enantiomeric organic compound (propylene oxide dissolved in PBLG/CDCl3).
 
de

  This approach, which consists in handling selectively each coupling in separate cross sections of the sample, is applied to the visualization of enantiomers dissolved in a chiral liquid crystalline phase. and we observe on the resulting spectrum an edition of multiplets which all involve the selected proton spin.
 
de

 These multiplets appear at the resonance frequencies from every other protons to which it is coupled: we show that this pulse sequence allows the observation of enantiomeric discrimination between both enantiomers dissolved in the PBLG/CDCl3 chiral liquid crystalline phase.(11)
 We also evaluate the robustness of this pulse sequence when it is used to probe fully coupled systems, through an analysis of the experimental artifacts that may be generated. We show that the signals that arise from pulse miscalibrations, or a difference in selectivity between spatially encoded excitation and refocusing pulses, do not contribute to the overall spectrum since they are removed by gradient selection. Only one kind of artifact, in addition to the desired signal, actually follows the defined magnetization pathways and appears on the overall spectrum (this artifact does not hinder the coupling network measurement). Interestingly, from all the artifacts that could be expected,our analysis indicates that the biggest artifacts which can be observed on this sample, are actually mainly due to a second-order coupling effect.

Application of δ-Resolved Spectroscopy to Probe Proton Chemical Shift Anisotropy

 We have applied an experiment, which was initially implemented by Zangger and Sterk (12) for the indirect acquisition of proton broadband homodecoupled spectra, to the visualisation of the differences in proton chemical shift anisotropy between enantiomers which are interacting with a chiral environment. We have implemented an enhanced -phased- version of this pulse sequence: the resulting 2D δ-resolved spectra allow to discriminate enantiomers when the variation of the proton chemical shift anisotropy is measurable.
 
de

 We have used an enhanced pulse sequence of this "δ-resolved" experiment to probe two chiral differentiation processes. Firstly, we use a lanthanide complex as a chiral shift reagent, and we probe its interaction with racemic isoborneol:
de

 Secondly, we exploit the differential ordering effect on enantiomers of butynol of a chiral liquid crystalline solvent composed of Poly-(γ-Benzyl)-L-Glutamate dissolved into deuterated chloroform (PBLG/CDCl3):
de

 For each sample, within one single 2D δ-resolved spectrum, we show that it is possible to probe the chiral differentiation process through every proton chemical shift where the variation in the chemical shift between each enantiomer is detectable.(13)

References

(1) Dong, R. Y., Nuclear Magnetic Resonance of Liquid Crystals (Partially Ordered Systems), Springer-Verlag Berlin, 1994, Ed. Springer-Verlag.
(2) Emsley, J.W., Nuclear Magnetic Resonance of Liquid Crystals, Kluwer Academic Publishers, 1984, D Reidel Pub Co.
(3) Merlet, D.; Ancian, B.; Courtieu, J.; Lesot, P., 1999, J. Am. Chem. Soc., 121, (22), 5249
(4) Sarfati, M.; Courtieu, J.; Lesot, P., Chem. Comm. 2000, (13), 1113-1114.
(5) Canet, I.; Courtieu, J.;Loewenstein, A.; Meddour, A.; Péchiné, J.M., 1995, J. Am. Chem. Soc., 117, 6520
(6) Meddour, A.; Berdague, P.; Hedli, A.; Courtieu, J.; Lesot, P., 1997, J. Am. Chem. Soc., 119, 4502
(7) Fäcke, T. and Berger, S., J. Magn. Reson. 1995, 113, 114-116.
(8) Béguin, L. ; Courtieu, J. ; Ziani, L. ; Merlet, D., Magn. Reson. Chem. 2006, (44), 1096-1101.
(9) Béguin, L., Giraud, N., Ouvrard, JM., Courtieu, J. and Merlet, D. J. Magn. Res. 2009.
(10) Giraud, N., Béguin, L., Courtieu, J. and Merlet, D., Ang. Chem. Int. Ed. 49 (20): 3481-3484, 2010
(11)  Merlet, D., Beguin, L., Courtieu, J. & Giraud, N.*,J. Magn. Res. 209 (2): 315-322 (2011)
(12) Zangger, K. and Sterk., H., J. Magn. Reson. 1997, 124, 486-489.
(13) Giraud, N., Joos, M., Courtieu, J. and Merlet, D., Magn. Res. Chem. 2009.

Three-dimensional solution NMR spectroscopy of complex structures and mixtures

.


 This paper reviews the non-biological applications of three dimensional NMR (3D-NMR) spectroscopy methodologies for studying chemical structures in polymer science, dendrimer research, organometallic chemistry, organosilicon chemistry, and mixtures of small organic molecules. Four methodologies for solving chemical structure problems are described, where the appropriate method is determined by the presence or absence of a third X nucleus (in addition to 1H and 13C) with suitable NMR properties.


Three-dimensional solution NMR spectroscopy of complex structures and mixtures

aDepartment of Chemistry, The University of Akron, Akron, USA
E-mail: PeterRinaldi@uakron.edu
Fax: 330-972-5256
Tel: 330-972-5990
Analyst, 2004,129, 687-699

DOI: 10.1039/B403435J

 http://pubs.rsc.org/en/content/articlelanding/2004/an/b403435j#!divAbstract


//////

Ethyl butanoate

.

 1H NMR of ethyl butyrate

 Ethyl butanoate - 1H spectrum(bottom) and COSY spectrum (top)

 ImagesHandler.ashx?logoNoURL=1&id=7475&w=150&h=150&.png

Reaction Procedure

You will be given a reaction flask that contains a carboxylic acid and an alcohol. Carefully add 1.0 mL (1.84 g) conc. sulfuric acid. The acid should be added dropwise with swirling. Add a boiling chip and attach a water cooled condenser. Reflux the solution for 60-75 minutes. During the reflux period the solution may turn cloudy and a second layer may form. If it does, this is your product. Not all the reaction mixtures will form two layers. Some mixtures will be colorless, others will be yellow or even dark brown.
After refluxing, disconnect the heating supply and allow the solution to cool to room temperature- you may cool it in a beaker of water. Transfer the reaction mixture to a 60 mL separatory funnel. Rinse the flask with 10 mL of water and transfer this to the separatory funnel, try to swirl the mixture. [CARE: when shaking mixtures, pressurization may occur, especially with the sodium bicarbonate extraction!] Cap the separatory funnel and shake, venting frequently, to mix the two layers. Allow the layers to separate and then drain and discard the lower aqueous layer. Next, wash the organic layer with 10 mL of saturated sodium bicarbonate. Finally, wash the organic layer with 10 mL of saturated aqueous sodium chloride. Dry the organic layer using anhydrous magnesium sulfate. Distill the final product to purify it and get a boiling point. Your product should distill between 50°C and 150°C. Put the receiver in an ice bath to help condense the product and reduce vapors. Take the mass of the distilled product, but you cannot calculate % yield.

 1H NMR


13C NMR


Spectral Data   Additional Data   Download

Type: 13C
Atom
No. ⇓
Mult.(coupling const.)
Meas.
Shift
1 S 171.6
4 T 59.7
5 T 36.2
6 T 18.9
7 Q 13.8
8 Q 14.5


/////////

A graph theory approach to structure solution of network materials from two-dimensional solid-state NMR data

.


An NMR crystallography strategy is presented for solving the structures of materials such as zeolites and related network materials from a combination of the unit cell and space group information derived from a diffraction experiment and a single two-dimensional NMR correlation spectrum that probes nearest-neighbour interactions. By requiring only a single 2D NMR spectrum, this strategy overcomes two limitations of previous approaches. First, the structures of materials having poor signal-to-noise in solid-state NMR experiments can be investigated using this approach since a series of 2D spectra is not required. Secondly, the structures of aluminophosphate materials can potentially be determined from 27Al/31P solid-state NMR experiments since this approach does not require the isolated spin pairs which have been important for determining structures of silicate materials by 29Si solid-state NMR. Using concepts from graph theory, the structure solution strategy is described in detail using a hypothetical two-dimensional network structure. A collection of two-dimensional network structures generated by the algorithm under various initial conditions is presented. The algorithm was tested on a series of 27 zeolite framework types found in the International Zeolite Association’s zeolite structure database. Finally, the structure of the zeolite ITQ-4 was solved from powder X-ray diffraction data and a single 29Si double quantum NMR correlation spectrum. The limitations of the strategy are discussed and new directions for this approach are outlined.


Graphical abstract: A graph theory approach to structure solution of network materials from two-dimensional solid-state NMR data 

A graph theory approach to structure solution of network materials from two-dimensional solid-state NMR data

*Corresponding authors
aDepartment of Chemistry, Redeemer University College, 777 Garner Road East, Ancaster ON, Canada L9K 1J4
E-mail: dbrouwer@redeemer.ca
CrystEngComm, 2013,15, 8748-8762

DOI: 10.1039/C3CE41058G

http://pubs.rsc.org/en/content/articlelanding/2013/ce/c3ce41058g#!divAbstract

/////