
TOFACITINIB
托法替布
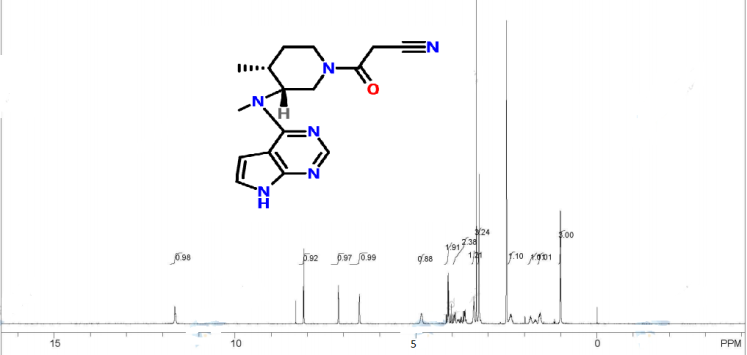
3-{(3R,4R)-4-methyl-3-[methyl-(7H-pyrrolo[2,3-d]pyrimidin-4-yl)-amino]-piperidin-1-yl}-3-oxo-propionitrile citrate salt
CAS number: 540737-29-9
An Improved and Efficient Process for the Preparation of Tofacitinib Citrate
Yogesh S. Patil, Nilesh L. Bonde, Ankush S. Kekan, Dhananjay G. Sathe*1, and Arijit Das
Publication Date (Web): November 17, 2014 (Article)
DOI: 10.1021/op500274j
MS m/z 313 (M+ + 1);
mp 201–202 °C;
1H NMR (CDCl3) δ 8.34 (s, 1H), δ 7.38 (d, 1H, J = 2.4 Hz), δ 6.93 (d, 1H, J = 2.4 Hz), δ 4.97 (m, 1H), δ 3.93–4.03 (m, 4H), δ 3.66 (m, 1H), δ 3.50 (m, 4H), δ 2.91 (d, 2H, J = 15.6 Hz), δ 2.80 (t, 2H, J = 12.8 Hz), δ 2.55 (m, 1H), δ 1.99 (m, 1H), δ 1.77 (m, 1H), δ 1.13–1.18 (m, 3H).
SEE.......http://newdrugapprovals.org/2015/07/24/tofacitinib-%E7%9A%84%E5%90%88%E6%88%90-spectral-visit/
NMR PREDICTION

SEEhttp://www.hoborchem.com/news/Chemical-Synthesis-of-Tofacitinib-Citrate-15.html

Tofacitinib, ananti-rheumatoid arthritis drug, was synthesized from N-[(3R,4R)-1-benzyl-4-methylpiperidin-3-yl]-N-methyl-7H-pyrrolo[2,3-d]pyrimidin-4-amine(7) by removing the benzyl group andcondensing with ethyl cyanoacetate in one-pot synthesis. The intermediate 7 could be obtainedfrom 4-chloro-7H-pyrrolo[2,3-d]pyrimidine(2) by protection, substitution and deprotection. The totalyield of tofacitinib was about 57%(based oncompound 2) with purity of 99.4%.
SEE.......http://newdrugapprovals.org/2015/07/24/tofacitinib-%E7%9A%84%E5%90%88%E6%88%90-spectral-visit/


 1H NMR


1H NMR picture from the net........not mine


/////
Development of Safe, Robust, Environmentally Responsible Processes for New Chemical Entities
- Dr. V. Rajappa, Director & Head-Process R&D, Bristol-Myers Squibb, India
A PRESENTATION

Scroll with mouse to view 76 pages
SEE SYNTHESIS AT
SEE.......http://newdrugapprovals.org/2015/07/24/tofacitinib-%E7%9A%84%E5%90%88%E6%88%90-spectral-visit/
GOA INDIA


 ANJUNA

RAVE


SEASGOA MINE


//////////////
Take a tour
SOLOMON ISLANDS


HONIARA


Malaita, Solomon Islands ...


 .
.


 .
.
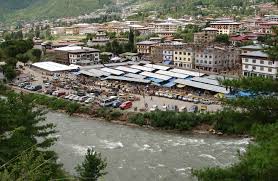
Gizo, on Ghizo Island, is the capital of the Solomon Islands’ far-flung Western Province, a paradise of coral cays, atolls, lagoons and volcanic islands east of Papua New Guinea where, on a rainy day in late July, crowds flocked to the local netball court for the opening of the inaugural Akuila Talasasa Arts Festival.
 Motorised canoes lined up in Gizo Harbour near the daily marketplace.


 .
.


///////// You mi
SEE.......http://newdrugapprovals.org/2015/07/24/tofacitinib-%E7%9A%84%E5%90%88%E6%88%90-spectral-visit/
NMR PREDICTION
H-NMR spectral analysis
![(3R,4R)-4-methyl-3-(methyl-1H-pyrrolo[2,3-d]pyrimidin-4-ylamino)-β-oxo-1-piperidinepropanenitrile NMR spectra analysis, Chemical CAS NO. 477600-75-2 NMR spectral analysis, (3R,4R)-4-methyl-3-(methyl-1H-pyrrolo[2,3-d]pyrimidin-4-ylamino)-β-oxo-1-piperidinepropanenitrile H-NMR spectrum](https://lh3.googleusercontent.com/blogger_img_proxy/AEn0k_vCjj1I3ESXzZ7iqFXSKPdrrfaZRU1YTZbpTHzqYuGxMxq3lR2ullmbtOgbbdbdRj2xob2vmysjJolm63GVSUhuC61xYW2TXp5JetidADBB6szcWj6n-f9ixmr46BaV2bqhmBN85LIna2EB_nPkvAQy02A2=s0-d) CAS NO. 477600-75-2, (3R,4R)-4-methyl-3-(methyl-1H-pyrrolo[2,3-d]pyrimidin-4-ylamino)-β-oxo-1-piperidinepropanenitrile H-NMR spectral analysis |
C-NMR spectral analysis
![(3R,4R)-4-methyl-3-(methyl-1H-pyrrolo[2,3-d]pyrimidin-4-ylamino)-β-oxo-1-piperidinepropanenitrile NMR spectra analysis, Chemical CAS NO. 477600-75-2 NMR spectral analysis, (3R,4R)-4-methyl-3-(methyl-1H-pyrrolo[2,3-d]pyrimidin-4-ylamino)-β-oxo-1-piperidinepropanenitrile C-NMR spectrum](https://lh3.googleusercontent.com/blogger_img_proxy/AEn0k_spU64wKUk3M1LQZYoPtVBF5BhVMgsQG8p5ur-jjzqZ0BCwUgE7SHuidc-MSU90ssi7oBTyMnPJBanvTRiqwq6Ibwa4kafkcEg9PDBSWe3MLQbhidmr5ZzFtQ88ScrCkpptkaJSSM81hgQYcnFSc6VWpgSd8A=s0-d) CAS NO. 477600-75-2, (3R,4R)-4-methyl-3-(methyl-1H-pyrrolo[2,3-d]pyrimidin-4-ylamino)-β-oxo-1-piperidinepropanenitrile C-NMR spectral analysis |
SEEhttp://www.hoborchem.com/news/Chemical-Synthesis-of-Tofacitinib-Citrate-15.html
Synthesis conditions for Tofacitinib Citrate (Xeljanz, CP-690550-10)
a)potassium tert-butoxide, Dimethyl carbonate, 2-methyltetrahydrofuran; toluene, 87% yield
b)5% Rh/C (Johnson-Matthey type C101023-5), acetic acid, hydrogen, 72-78°C, 70-80 psi, 75% yield (92.7% cis by GC)
c)benzaldehyde, sodium triacetoxyborohydride, toluene, 73% yield (96.6% cis and 2.5% trans by GC)
d)lithium aluminum hydride, tetrahydrofuran
e)concentrated hydrochloric acid, isopropanol, 87% yield (99.3% cis and 0.7% trans by GC)
f)di-p-toluoyl-L-tartaric acid, sodium hydroxide, water, methanol,42% yield (98.6% enantiomeric excess, 0.6% trans isomer by GC)
g)2,4-dichloro-7H-pyrrolo[2,3-d]pyrimidine, potassium carbonate,water, 95-105° C, 100% yield
h)20 weight% palladium hydroxide on carbon (50% water wet), water, hydrogen,70-75°C, 50 psi
i)ethyl cyanoacetate, 1-butanol,1,8-diazabicyclo[5.4.0]-undec-7-ene(DBU),40 °C, 20 h
j)citric acid monohydrate, water, 1-butanol, 81 °C, 93% yield
References:
Procedures (a) to (e)
Weiling Cai, James L. Colony,Heather Frost, James P. Hudspeth, Peter M.
Kendall, Ashwin M. Krishnan,Teresa Makowski, Duane J. Mazur, James
Phillips, David H. Brown Ripin, Sally Gut Ruggeri, Jay F. Stearns, and
Timothy D. White; Investigation of Practical Routes for the Kilogram-Scale Production of cis-3-Methylamino-4-methylpiperidines; Organic Process Research & Development 2005, 9, 51−56
Ripin, D. H.B.; 3-amino-piperidine derivatives and methods of manufacture, US patent application publication, US 2004/0102627 A1
Procedures (f) to (h)
Ruggeri, Sally, Gut;Hawkins, Joel, Michael; Makowski, Teresa, Margaret; Rutherford, Jennifer, Lea; Urban,Frank,John;Pyrrolo[2,3-d]pyrimidine derivatives: their intermediates and synthesis, PCT pub. No. WO 2007/012953 A 2, US20120259115 A1, United States Patent US8232393. Patent Issue Date: July 31, 2012
Procedures (i) to (j)
Kristin E. Price, Claude Larrive´e-Aboussafy, Brett M. Lillie, Robert
W. McLaughlin, Jason Mustakis, Kevin W. Hettenbach, Joel M. Hawkins, and
Rajappa Vaidyanathan; Mild and Efficient DBU-Catalyzed Amidation of Cyanoacetates, Organic Letters, 2009, vol.11, No.9, 2003-2006
Detailed production procedures for the synthesis of Tofacitinib Citrate (Xeljanz, CP-690550-10) SEEhttp://www.hoborchem.com/news/Chemical-Synthesis-of-Tofacitinib-Citrate-15.html
a
Preparation of 4-methyl-pyridin-3-yl)-carbamic acid methyl ester (3-Methoxycarbonylamino-4-methylpyridine)
Preparation of 4-methyl-pyridin-3-yl)-carbamic acid methyl ester (3-Methoxycarbonylamino-4-methylpyridine)
To a clean, dry, nitrogen-purged 800 L reactor were charged
3-amino-4-methylpyridine (49.9 kg, 461 mol) and 2-methyltetrahydrofuran
(383 L). The reaction was heated to 32- 38 °C for at least 90 min. To a
clean, dry, nitrogen-purged 2000 L reactor were charged potassium
tert-butoxide (104.0 kg, 927 mol) and 2-methyltetrahydrofuran (255 L).
The reaction was stirred at 23-27 °C for at least 30 min to break up the
potassium tert-butoxide. Dimethyl carbonate (49.9 kg, 554 mol) was
added to the slurry of potassium tert-butoxide at a rate that maintained
the temperature below 35 °C. The 3-amino-4-methylpyridine solution was
added to the 2000 L reactor at a rate that maintained the temperature
from 20 to 35 °C. An additional 115 L of 2-methyltetrahydrofuran was
added to aid stirring. The mixture was stirred between 20 and 35 °C for
at least 2 h. The reaction was sampled and checked for completion by GC,
then cooled to 15-20 °C. Water (255 L) was added at a rate to maintain
the temper-ature below 25 °C. The mixture was stirred for at least 30
min then allowed to settle for at least 60 min. The phases were
separated, and 2-methyltetrahydrofuran (255 L) was added to the aqueous
layer. The reaction mixture was allowed to stir for at least 60 min and
then allowed to settle for at least 60 min. The phases were separated,
and the 2-meth-yltetrahydrofuran layers were combined. Darco KBB (10.0
kg) was added to the organic layer and allowed to stir for at least 30
min. The Darco slurry was filtered through a bed of Celite, and the cake
was washed with 2-methyltetrahydro-furan (51 L). The
2-methyltetrahydrofuran was displaced with toluene under vacuum to a
final volume of 480-540 L, then the mixture was cooled to 23-27 °C over
at least 90 min. After sampling to ensure that the water content was
<1%, the slurry was stirred for at least 12 h. The resulting solids
were filtered and washed with toluene (212 L). After drying under vacuum
at 40-50 °C for at least 12 h with a slight nitrogen bleed, 66.5 kg
(400 mol) of (4-methyl-pyridin- 3-yl)carbamic acid methyl ester was
isolated in 86.7% yield (99.89% purity by HPLC) mp: 115.3-116.6 °C. 1H
NMR (400 MHz, DMSO): ä 9.12 (bs, 1H), 8.46 (s, 1H), 8.18 (d, J ) 4.9 Hz,
1H), 7.20 (d, J ) 4.9 Hz, 1H), 3.64 (s, 3H), 2.19 (s, 3H). 13C NMR
(DMSO): 155.6, 146.5, 146.3, 141.4, 134.2, 125.9, 52.6, 17.8. Anal.
Calcd for C8H10N2O2:C, 57.82; H, 6.07; N, 16.86. Found: C, 57.71; H,
5.80; N, 16.85.
b
b
Preparation of cis-3-Methoxycarbonylamino-4-methylpiperidine SEEhttp://www.hoborchem.com/news/Chemical-Synthesis-of-Tofacitinib-Citrate-15.html
To a clean, nitrogen-purged 1200 L reactor were charged Darco KBB14
(6.6 kg), (4-methyl-pyridin-3-yl)carbamic acid methyl ester (66.5 kg)
and acetic acid (677 L). The mixture was stirred for at least 30 min at
20-30 °C and filtered through a bed of Celite, and the cake was washed
with acetic acid (135 L). To a clean, nitrogen-purged 2000 L
hydrogena-tion reactor were charged 5% Rh/C (Johnson-Matthey type
C101023-5, 16.5 kg) and the (4-methyl-pyridin-3-yl)carbamic acid methyl
ester acetic acid solution. The reaction was stirred for at least 15 min
and then purged sequentially with nitrogen and hydrogen. The reaction
was heated to 72-78 °C and then pressurized with hydrogen gas at 70-80
psig. The reaction was allowed to stir under these conditions until
hydrogen uptake ceased. A sample was obtained for reaction completion
check by GC. The reaction was purged with nitrogen, and the catalyst was
filtered on a water-wet Celite-coated filter. The cake was washed with
toluene (212 gal), and the filtrates were combined. The solution of
(4-methyl-pipridin-3-yl)carbamic acid methyl ester (92.7% cis by GC) was
used in the next step without further purification. In the lab, an
aliquot (0.50 g) of the reduced product was purified via silica gel
chromatography (20% EtOAc-hexanes) to yield purified product (0.38 g).
The purified product was dissolved in IPE (10 mL) and treated with
bubbling HCl gas. The white solid was filtered and dried under vacuum to
yield a white solid (11.9 g, 75%) mp 199-200.5 °C. Rf freebase) ) 0.21
(5:1 CH2Cl2-CH3OH). Anal. Calcd for C8H17ClN2O2: C,46.04; H, 8.21; N,
13.42. Found: C, 46.93; H, 8.84; N, 12.29. 1H NMR (HCl salt) (400 MHz,
CD3OD): ä 6.94 (bs, 1H), 3.95 (m, 1H), 3.66 (m, 4H), 3.38 (dd, J )
13.27, 4.15, 1H), 3.28 (m, 1H), 3.14 (dd, J ) 13.27, 3.11, 1H), 3.05
(ddd, J ) 12.85, 9.95, 4.56 1H), 2.07 (m, 1H), 1.74 (m, 2H), 1.01 (d, J )
7.05, 3H). 13C NMR (300 MHz, CD3OD): ä 158.0, 51.6, 48.7, 46.7, 42.9,
31.1, 25.6, 15.1.
c
c
Preparation of cis-N-Benzyl-3-methoxycarbonylamino-4-methylpipe-ridine HydrochlorideSEEhttp://www.hoborchem.com/news/Chemical-Synthesis-of-Tofacitinib-Citrate-15.html
To a clean, nitrogen-purged 2000 L reactor was charged
(4-methyl-piperidin-3-yl)carbamic acid methyl ester as the crude acetic
acid and toluene solution from the previous step. The acetic acid was
displaced with toluene under vacuum to a final volume of 500-560 L. The
reaction was cooled and a sample pulled to check for an acetic acid
content of <4% as determined by 1H NMR. Benzaldehyde (46.4 kg, 437
mol) was added to the reaction at 20-30 °C and stirred for at least 30
min. To a clean, dry, nitrogen-purged reactor were charged sodium
triacetoxy-borohydride (92.6 kg, 437 mol) and toluene (472 L). The
mixture was allowed to stir for at least 60 min at 20-30 °C. The
benzaldehyde solution was transferred to the sodium
triacetoxyborohydride reactor at a rate that maintained the temperature
from 20 to 30 °C, then the reaction was stirred for at least 2 h. The
reaction was sampled and checked for completion by GC. It was quenched
by addition of a solution of 50% aqueous sodium hydroxide (158.9 kg
diluted with 352 gal of water), maintaining the temperature at 20-30 °C,
until a pH between 6 and 7 was achieved. The reaction was then stirred
for at least 60 min and allowed to settle for at least 60 min, and the
phases were separated. The toluene layer was heated to 70-80 °C, and
concentrated HCl (47.0 kg, 477 mol) was added over at least 30 min. The
reaction was held from 70 to 80 °C for at least 60 min. The reaction was
cooled to 15-25 °C over at least 60 min and held for at least 2 h. The
resulting solids were filtered, and the cake was washed with toluene
(190 L). After drying under vacuum at 40-50 °C for at least 12 h with a
slight nitrogen bleed,
cis-N-benzyl-3-methoxycarbonylamino-4-methylpiperidine hy-drochloride
(86.8 kg, 290 mol) was isolated in 73.1% yield over two steps (96.6% cis
and 2.5% trans by GC) mp: 187.3-191.4 °C. 1H NMR (400 MHz, CDCl3): ä
12.11 (bs, 1H), 7.57-7.52 (m, 3H), 7.43-7.39 (m, 3H), 4.26 (dd, J )
13.3, 4.6 Hz, 1H), 4.16 (bd, J ) 9.9 Hz, 1H), 4.07 (dd, J ) 13.3, 5.8
Hz, 1H), 3.60 (s, 3H), 3.49 (bd, J ) 12.0 Hz, 1H), 3.29 (dd, J ) 12.9,
2.1 Hz, 1H), 2.89 (ddd, J ) 12.9, 10.8, 3.3 Hz, 1H), 2.74 (dddd, J )
12.4, 12.0, 9.5, 2.9 Hz, 1H), 2.22 (dddd, J ) 13.3, 13.0, 12.4, 3.9 Hz,
1H), 1.82-1.74 (m, 1H), 1.64 (bd, J ) 13.0 Hz, 1H), 0.94 (d, J ) 6.6 Hz,
3H). 13C NMR (CDCl3): 157.8, 131.8, 130.5, 129.6, 127.9, 61.3, 56.8,
53.1, 52.5, 48.6, 32.6, 26.2, 17.2. Anal. Calcd for C15H23ClN2O2: C,
60.29; H, 7.76; N, 9.38. Found: C, 60.21; H, 7.83; N, 9.29.
d
d
Preparation of cis-N-Benzyl-3-methylamino-4-methypiperidine Bis-(hydrochloride)SEEhttp://www.hoborchem.com/news/Chemical-Synthesis-of-Tofacitinib-Citrate-15.html
To a clean, dry, nitrogen-purged 2000 L reactor were charged
(1-benzyl-4-methyl-piperidin-3-yl)-carbamic acid methyl ester
hydrochloride (41.9 kg, 140 mol) and tetrahydrofuran (685 L). The
reactor was purged three times with nitrogen and allowed to stir for at
least 45 min at 20-30 °C to break up the solids. A sample was pulled to
ensure that the water content was <0.2% water. The reaction was
cooled to between -15 to 5 °C, and a 1.0 M solution of lithium aluminum
hydride in tetrahydrofuran (181.4 kg, 200 mol) was added at a rate to
maintain the temperature from -15 to 5 °C. The charge line was rinsed
with tetrahydrofuran (19 gal), and the reaction was heated and held at
reflux for at least 2.5 h. After cooling to 20-30 °C, the reaction was
sampled and checked for completion by GC. The reaction was cooled to
between -10 and 5 °C and a chilled (-10 to 5 °C) solution of
tetrahydrofuran (43 L) and water (16.3 kg) was added at a rate to
maintain the temperature at -10 to 5 °C with slight nitrogen bleed. The
reaction was then heated to 20-25 °C over at least 60 min and purged
with nitrogen to remove any traces of hydrogen. The resulting aluminum
solids were filtered and washed with tetrahydrofuran (2 86 L). The
tetrahydrofuran was displaced with 2-propanol until a temperature of at
least 78 °C and a reaction volume was of 460-540 L were achieved. The
reaction was cooled to 65-75 °C, and concentrated HCl (28.9 kg, 294 mol)
was added over at least 60 min. The displacement was continued until
additional 2-propanol (1060 L) was added and the final temp was at least
81 °C and the final volume was 390-460 L. The reaction was cooled to
between 65 and 75 °C and granulated for at least 2 h. The reaction was
cooled to between 15 and 25 °C, and a sample was pulled to ensure that
the water content was <1%. After stirring at least2hat15-25 °C, the
solids were filtered and washed with 2-propanol (85 L). After drying
under vacuum for at least 12 h at 40-50 °C with a slight nitrogen bleed
(cis-N-benzyl-3-methylamino-4-methypiperidine bis-(hydrochloride) (35.5
kg, 122 mol) was isolated in 87.1%yield (99.3% cis and 0.70% trans by
GC) mp: 261.3-267.0 °C. 1H NMR (400 MHz, 1:1 CD3CN:D2O): ä 7.51-7.43 (m,
5H), 4.36-4.27 (m, 2H), 3.62-3.59 (m, 2H), 3.24- 3.13 (m, 3H), 2.65 (s,
3H), 2. (m, 1H), 1.95-1.91 (m, 1H), 1.82-1.75 (m, 1H), 1.03 (d, J ) 7.5
Hz, 3H). 13C NMR (1:1 CD3CN:D2O): 131.8, 130.5, 129.6, 128.6, 118.7,
61.0, 55.8, 46.4, 31.3, 27.5, 26.0, 10.0. Anal. Calcd for C14H24-Cl2N2:
C, 57.73; H, 8.31; N, 9.62. Found: C, 57.77; H, 8.30; N, 9.60.
e
e
Preparation of bis-(3R,4R)-(1-benzyl-4-methyl-piperidine-3-yl)-methylamine di-p-toluoyl-L-tartaric acidSEEhttp://www.hoborchem.com/news/Chemical-Synthesis-of-Tofacitinib-Citrate-15.html
To a clean, dry, nitrogen-purged 250 ml flask were charged racemic
cis-(1-benzyl-4-methyl-piperidine-3-yl)-methylamine bis hydrochloride
(20.0 g, 68.7 mmol), di-p-toluoyl-L-tartaric acid (L-DPTT) (15.9 g, 41.2
mmol) and methanol (100 ml). A solution of sodium hydroxide (5.5 g,
137.3 mmol in water (100 ml)) was added to the reaction at a rate to
maintain the temperature below 30° C. The reaction was heated to between
70-80° C. and held at this temperature for at least 60 minutes. The
reaction was cooled to 5-15° C. over at least 4 hours and held at this
temperature for at least 12 hours. The solids were filtered and washed
with a 1:1 mixture of MeOH:water (60 ml). The wet-cake was returned to
the 250 ml flask and methanol (100 ml) and water (100 ml) were charged.
The reaction was heated to between 70-80° C. and held at this
temperature for at least 120 minutes. The reaction was cooled to 5-15°
C. over at least 4 hours and held at this temperature for at least 12
hours. The solids were filtered and washed with a 1:1 mixture of
MeOH:water (60 ml). The wet-cake was sampled for purity (99.4% ee) to
ensure an additional repulp was not necessary. After drying under vacuum
at 40-50° C. for at least 24 hours with a slight nitrogen bleed, the
title compound (11.9 g, 28.9 mmol) was isolated in 42.1% yield (98.6%
enantiomeric excess, 0.63% trans isomer by GC (Cyclosil B column 30
m×I.D. 0.25 mm; Inlet Temp 250; 2.0 ml/min flow rate; 15 min run; 160 C
isothermal method.
f
f
Preparation of N-[(3R,4R)-1-benzyl-4-methylpiperidin-3-yl]-2-chloro-N-methyl-7H-pyrrolo[2,3-d]pyrimidin-4-amine SEEhttp://www.hoborchem.com/news/Chemical-Synthesis-of-Tofacitinib-Citrate-15.html
To a clean, dry, nitrogen-purged 500 ml reactor were charged
2,4-dichloro-7H-pyrrolo[2,3-d]pyrimidine, prepared as described below,
(20.0 g, 0.106 mol),
bis-(3R,4R)-(1-benzyl-4-methyl-piperidine-3-yl)-methylamine
di-p-toluoyl-L-tartaric acid (20 g, 0.106 mol), potassium carbonate
(44.6 g, 0.319 mol) and water (200 ml). The reactor was heated to
95-105° C. for a minimum of 10 hours then cooled to 20-30° C. and held
for a minimum of 3 hours. The resulting solids were isolated by
filtration, washed with water (60 ml) and dried at 50° C. to afford 39.5
g (100%) of the title compound.
Anal. Calcd. for C20H24ClN5: C, 64.94; H, 6.54; N, 18.93; Found: C, 64.78; H, 6.65; N, 18.83. 1H NMR (400 MHz, d6-acetone):
δ 10.80 (bs, 1H), 7.36 (d, J=7.0 Hz, 2H), 7.30 (t, J=7.0 Hz, 2H),
7.24-7.20 (m, 1H), 7.13 (d, J=3.7 Hz, 1H), 6.66 (bs, 1H), 5.15 (bs, 1H),
3.69 (bs, 3H), 3.54 (ABq, J=13.3 Hz, 1H), 3.50 (ABq,
J=13.3 Hz, 1H), 2.92 (dd, J=12.0, 5.4 Hz, 1H), 2.88-2.83 (m, 1H), 2.77
(bs, 1H), 2.64-2.59 (m, 1H), 2.29 (bs, 1H), 2.16 (bs, 1H), 1.75-1.69 (m,
2H), 0.94 (d, J=6.6 Hz, 3H). 13C NMR (400 MHz, d6-DMSO,
mixture of Isomers): 158.0, 152.5, 151.8, 138.3, 129.1, 128.6, 128.1,
127.6, 126.8, 121.0, 102.3, 100.8, 62.5, 54.6, 53.1, 50.8, 35.3, 32.0,
30.9, 15.3.
g
g
Preparation of 2,4-dichloro-7H-pyrrolo[2,3-d]pyrimidineSEEhttp://www.hoborchem.com/news/Chemical-Synthesis-of-Tofacitinib-Citrate-15.html
A reactor was equipped with 7H-pyrrolo[2,3-d]pyrimidine-2,4-diol(10.0g,
66.2 mmol) and toluene (30 ml) with stirring. Phosphorusoxychloride
(18.5 ml, 198.5 mmol) was added and the reactor was warmed to 700C.
Diisopropylethylamine (23.0 m, 132.3 mmol) was added over 2.5 h to
control the exotherm. After completion of the base addition, the reactor
was heated to 1060C and stirred at temperature for 16 h. The mixture was cooled to 250C
and added slowly to a flask containing water (230 ml) and ethyl acetate
(120ml) at room temperature, then stirred overnight at room
temperature. After filtration through Celite, the layers were separated
the aqueous layer was extracted with ethyl acetate (3 x 75ml). The
organic layers were combined and washed with brine (100ml). Darco KBB
(1.24 g) was added to the organics, then filtered through Celite and
dried over sodium sulfate (10.0 g). The solution was concentrated in
vacuo to obtain the title compound (52% yield).
h
h
Preparation of methyl-[(3R,4R)-4-methyl-piperidin-3-yl]-(7H-pyrrolo[2,3-d]pyrimidin-4-yl)amineSEEhttp://www.hoborchem.com/news/Chemical-Synthesis-of-Tofacitinib-Citrate-15.html
To a clean, dry, nitrogen-purged 500 ml hydrogenation reactor were charged 20 wt % Pd(OH)2/C
(palladium hydroxide on carbon) (5.0 g, 50% water wet), water (200 ml),
and
N-((3R,4R)-1-benzyl-4-methylpiperidin-3-yl)-2-chloro-N-methyl-7H-pyrrolo[2,3-d]pyrimidin-4-amine
(50.0 g, 0.135 mol). The reactor was purged three times at 50 psi with
nitrogen and three times at 50 psi with hydrogen. Once purging was
complete, the reactor was heated to 70-75° C. and pressurized to 50 psi
with hydrogen through a continuous feed. The hydrogen uptake was
monitored until no hydrogen was consumed for a minimum of 1 hour. The
reactor was cooled to 20-30° C. and purged three times at 50 psi with
nitrogen. The reaction mixture was filtered through water-wet Celite and
transferred to a clean, dry, nitrogen-purged 500 ml reactor for
subsequent processing.
Mp 158.6-159.8° C. 1H NMR (400 MHz, CDCl3):
δ 11.38 (bs, 1H), 8.30 (s, 1H), 7.05 (d, J=3.5 Hz, 1H), 6.54 (d, J=3.5
Hz, 1H), 4.89-4.87 (m, 1H), 3.39 (s, 3H), 3.27 (dd, J=12.0, 9.3 Hz, 1H),
3.04 (dd, J=12.0, 3.9 Hz, 1H), 2.94 (td, J=12.6, 3.1 Hz, 1H0, 2.84 (dt,
J=12.6, 4.3 Hz, 1H), 2.51-2.48 (m, 1H), 2.12 (bs, 2H), 1.89 (ddt,
J=13.7, 10.6, 4 Hz, 1H), 1.62 (dq, J=13.7, 4Hz, 1H), 1.07 (d, J=7.3 Hz,
3H). 13C NMR (400 MHz, CDCl3): δ 157.9, 152.0, 151.0, 120.0, 103.0, 102.5, 56.3, 46.2, 42.4, 34.7, 33.4, 32.4, 14.3.
i
i
Preparation
of
3-{(3R,4R)-4-methyl-3-[methyl-(7H-pyrrolo[2,3-d]pyrimidin-4-yl)-amino]-piperidin-1-yl}-3-oxo-propionitrile
citrate salt (Tofacitinib citrate, Xeljanz, CP-690550-10) SEEhttp://www.hoborchem.com/news/Chemical-Synthesis-of-Tofacitinib-Citrate-15.html
To a round-bottomed flask fitted with a temperature probe, condenser,
nitrogen source, and heating
mantle, methyl-[(3R,4R)-4-methyl-piperidin-3-yl]-(7H-pyrrolo[2,3-d]pyrimidin-4-yl)-amine (5.0
g, 20.4 mmol) was added followed by 1-butanol (15 mL), ethyl
cyanoacetate (4.6 g, 40.8 mmol), and DBU (1.6 g, 10.2 mmol). The
resulting amber solution was stirred at 40 °C for 20 h. Upon reaction
completion, citric acid monohydrate (8.57 g, 40.8 mmol) was added
followed by water (7.5 mL) and 1-butanol (39.5 mL). The mixture was
heated to 81 °C and held at that temperature for 30 min. The mixture was
then cooled slowly to 22 ºC and stirred for 2 h. The slurry was
filtered and washed with 1-butanol (20 mL). The filter cake was dried in
a vacuum oven at 80 °C to afford 9.6 g (93%) of tofacitinib citrate as
an off-white solid.
1H NMR (500 MHz, d6-DMSO):
δ 8.14 (s, 1H), 7.11 (d, J=3.6 Hz, 1H), 6.57 (d, J=3.6 Hz, 1H), 4.96
(q, J=6.0 Hz, 1H), 4.00-3.90 (m, 2H), 3.80 (m, 2H), 3.51 (m, 1H), 3.32
(s, 3H), 2.80 (Abq, J=15.6 Hz, 2H), 2.71 (Abq, J=15.6 Hz, 2H), 2.52-2.50 (m, 1H), 2.45-2.41 (m, 1H), 1.81 (m, 1H), 1.69-1.65 (m, 1H), 1.04 (d, J=6.9 Hz, 3H).
SEE.......http://newdrugapprovals.org/2015/07/24/tofacitinib-%E7%9A%84%E5%90%88%E6%88%90-spectral-visit/
....................SEE.......http://newdrugapprovals.org/2015/07/24/tofacitinib-%E7%9A%84%E5%90%88%E6%88%90-spectral-visit/
Synthesis of Tofacitinib
ZHANG Zhongkui, KUANG Chunxiang*
(Dept. ofChemistry, Tongji University, Shanghai 200092)
Tofacitinib, ananti-rheumatoid arthritis drug, was synthesized from N-[(3R,4R)-1-benzyl-4-methylpiperidin-3-yl]-N-methyl-7H-pyrrolo[2,3-d]pyrimidin-4-amine(7) by removing the benzyl group andcondensing with ethyl cyanoacetate in one-pot synthesis. The intermediate 7 could be obtainedfrom 4-chloro-7H-pyrrolo[2,3-d]pyrimidine(2) by protection, substitution and deprotection. The totalyield of tofacitinib was about 57%(based oncompound 2) with purity of 99.4%.
SEE.......http://newdrugapprovals.org/2015/07/24/tofacitinib-%E7%9A%84%E5%90%88%E6%88%90-spectral-visit/


SEE.......http://newdrugapprovals.org/2015/07/24/tofacitinib-%E7%9A%84%E5%90%88%E6%88%90-spectral-visit/
13C NMR PREDICT


/////
Development of Safe, Robust, Environmentally Responsible Processes for New Chemical Entities
- Dr. V. Rajappa, Director & Head-Process R&D, Bristol-Myers Squibb, India
A PRESENTATION
Scroll with mouse to view 76 pages
SEE SYNTHESIS AT
SEE.......http://newdrugapprovals.org/2015/07/24/tofacitinib-%E7%9A%84%E5%90%88%E6%88%90-spectral-visit/
GOA INDIA
Goa - Wikipedia, the free encyclopedia
en.wikipedia.org/wiki/Goa
Goa is visited by large numbers of international and domestic tourists each year for its beaches, places of worship and world heritage architecture. It also has ...
ANJUNARAVE
SEASGOA MINE
//////////////
Take a tour
SOLOMON ISLANDS
HONIARA
Malaita, Solomon Islands ...
.Gizo, on Ghizo Island, is the capital of the Solomon Islands’ far-flung Western Province, a paradise of coral cays, atolls, lagoons and volcanic islands east of Papua New Guinea where, on a rainy day in late July, crowds flocked to the local netball court for the opening of the inaugural Akuila Talasasa Arts Festival.
///////// You mi


 .
.


![Graphical abstract: Supramolecular “containers”: self-assembly and functionalization of thiacalix[4]arenes for recognition of amino- and dicarboxylic acids](https://lh3.googleusercontent.com/blogger_img_proxy/AEn0k_vJEC_fMwhDWSWr8FAbMNofKhCNZKJsY0ut1-7Ul6nmZWdhh9ST1GXX3vSFXSNaqWbDGCIEoFMaJx03OwrRvEdfnEVkVJtgC3SD40PCttMmGAkBwptT7A8AisAas4L3IQ5OnkapbCT_Qa9kZ4O77jL2LumsMq4OxoJ3cOWzVTIDTt1jXLh7X7ztP791jLNgB7qtBbC3yXMTQYCgVUTTHYrOPQ=s0-d "Graphical abstract")