DR ANTHONY MELVIN CRASTO,WorldDrugTracker, helping millions, A 90 % paralysed man in action for you, I am suffering from transverse mylitis and bound to a wheel chair, With death on the horizon, nothing will not stop me except God................DR ANTHONY MELVIN CRASTO Ph.D ( ICT, Mumbai) , INDIA 25Yrs Exp. in the feld of Organic Chemistry,Working for GLENMARK GENERICS at Navi Mumbai, INDIA. Serving chemists around the world. Helping them with websites on Chemistry.Million hits on google, world acclamation from industry, academia, drug authorities for websites, blogs and educational contribution

Saturday 4 November 2017

19F NMR

19F NMR
According to quantum mechanics, any nucleus is magnetically active if it possess a nonzero angular moment, P, which gives rise to a nuclear magnetic moment, µ, capable of interacting with an external magnetic field (Eq. 1).
(1)                                 µ = γP
The magnetogyric ratio, γ, is the ratio of magnet moment to angular momentum. It relates the magnetic resonance (MR) frequency of a nuclide and the strength, or sensitivity of response of interaction of the nuclide when it is subjected to an external magnetic field. The 1H nucleus has the largest γ value (26.752 107 rad T-1 s-1) of stable isotopes on the NMR periodic table, making it the most sensitive to nuclear resonance excitation. The 19F nuclide comes next with a high magnetogyric ratio (25.18 107 rad T-1 s-1) at 94% of 1H, and has the advantage of 100% natural abundance. In combination, the result is a high relative sensitivity of 83% for fluorine.
With a dedicated Thermo Scientific™ picoSpin™ 45 19F NMR spectrometer, measuring19F NMR spectra in a bench-top instrument is as easy as acquiring proton spectra from the picoSpin™ 45 1H NMR spectrometer. A dedicated 19F spectrometer is tuned to the fluorine Larmor frequency (42.4 MHz) to yield the highest sensitivity for this nuclide. This application note presents 19F NMR spectra acquired from highly fluorinated small organic compounds, demonstrating the wealth of spectral information obtained from a bench-top picoSpin™ 45 19F NMR spectrometer.
Figure 1. Full 19F NMR (42.4 MHz) spectrum of hexaflourobenzene (neat); 25 scansFigure 1. Full 19F NMR (42.4 MHz) spectrum of hexaflourobenzene (neat); 25 scans
Figure 2. Full 19F NMR (42.4 MHz) spectrum of octafluorotoluene (neat); 36 scansFigure 2. Full 19F NMR (42.4 MHz) spectrum of octafluorotoluene (neat); 36 scans
Figure 3. Full 19F NMR (42.4 MHz) spectrum of 2H,3H-decafuoropantane (neat)Figure 3. Full 19F NMR (42.4 MHz) spectrum of 2H,3H-decafuoropantane (neat)
Figure 4. Full 19F NMR (42.4 MHz) spectrum of hexafluoroisopropanol in trifluorotoluene (70:30 v/v)Figure 4. Full 19F NMR (42.4 MHz) spectrum of hexafluoroisopropanol in trifluorotoluene (70:30 v/v)
Figure 5. Full 1H NMR (45 MHz) spectrum of hexafluoroisopropanol in trifluorotoluene (70:30 v/v)Figure 5. Full 1H NMR (45 MHz) spectrum of hexafluoroisopropanol in trifluorotoluene (70:30 v/v)

Friday 3 November 2017

An efficient green protocol for the synthesis of tetra-substituted imidazoles catalyzed by zeolite BEA: effect of surface acidity and polarity of zeolite

Image result for Kalpana C. Maheria sv
1-benzyl-2, 4, 5-triphenyl-1H-imidazole
STR1 STR2 str3
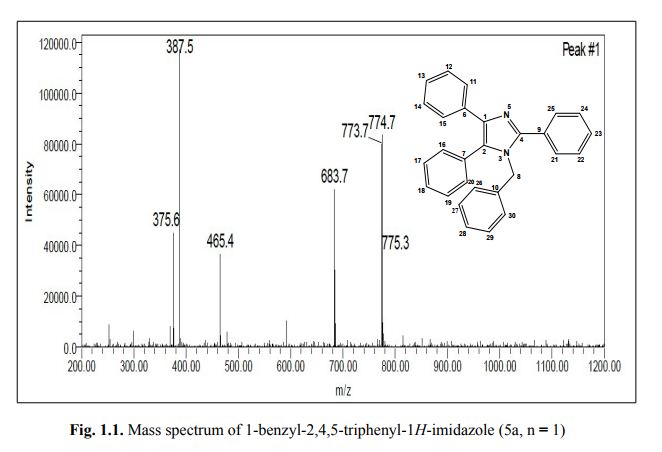
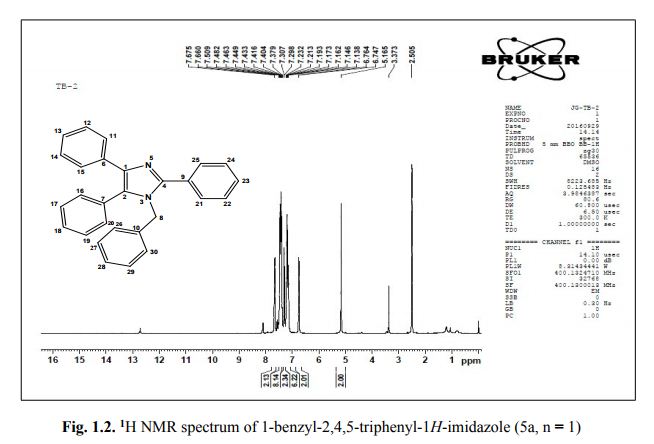
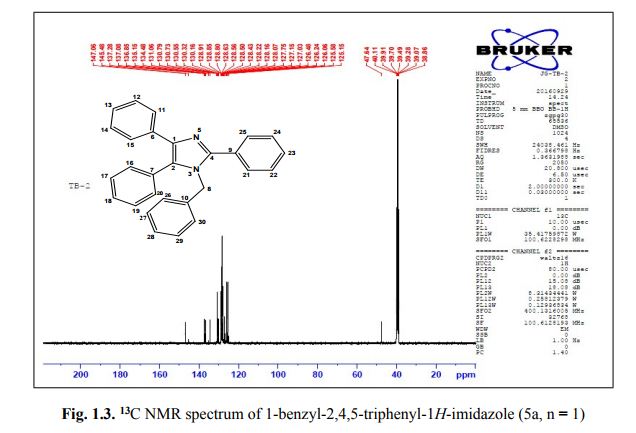
. 1-Benzyl-2,4,5-triphenyl-1H-imidazole (5a, n = 1).
Off-white solid; m.p.: 160–162 °C;
anal. calcd. for C28H22N2: C, 87.01, H, 5.74, N, 7.25%. Found: C, 87.13, H, 5.70, N, 7.19%;
UV (λmax, ethanol) = 280 nm;
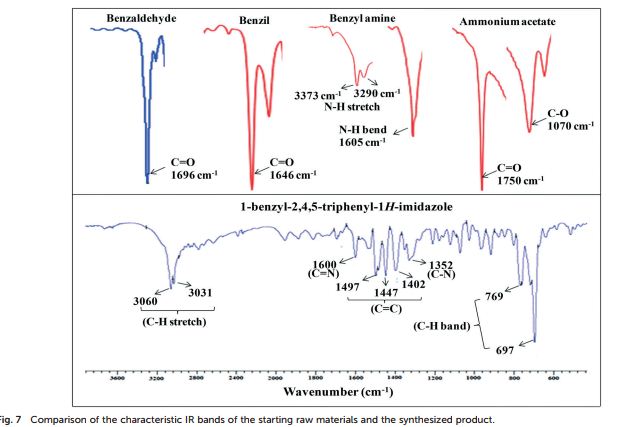
FT-IR (KBr, cm−1 ): 3060 (C–H stretch), 3031, 1600 (CN), 1497, 1483, 1447 (CC), 1352 (C–N stretch), 769, 697 (C–H band);
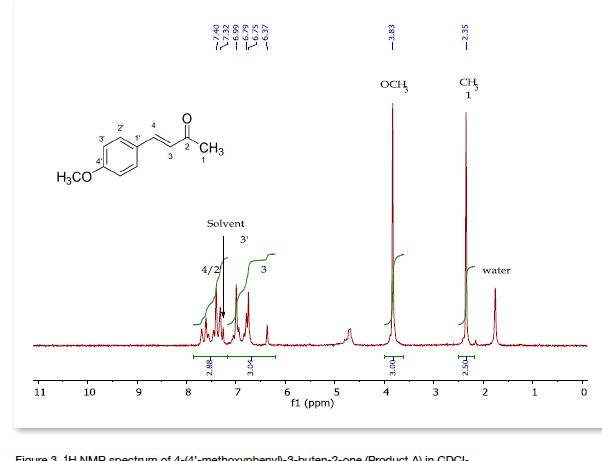
1 H NMR (400 MHz, DMSO): 5.16 (s, 2H, CH2), 6.74–7.67 (m, 20H, Ar–H) ppm;
13C NMR (100 MHz, DMSO): 47.6 (CH2, C8), 125.1 (CHarom, C28), 126.0 (CHarom, C26), 126.2 (CHarom, C30), 126.4 (CHarom, C11), 127.0 (CHarom, C15), 127.1 (CHarom, C16), 127.7 (CHarom, C20), 128.0 (CHarom, C21), 128.1 (CHarom, C25), 128.4 (CHarom, C13), 128.5 (CHarom, C18), 128.6 (CHarom, C27), 128.8 (C1), 128.8 (CHarom, C12), 128.9 (CHarom, C14), 130.1 (CHarom, C17), 130.3 (CHarom, C19), 130.5 (CHarom, C22), 130.7 (CHarom, C24), 131.0 (CHarom, C29), 134.4 (CHarom, C9), 135.1 (CHarom, C23), 136.8 (CHarom, C7), 137.0 (CHarom, C10), 137.2 (CHarom, C6), 145.4 (C2), 147.0 (C4) ppm;
MS: m/z = 387.5 (M + H)+

An efficient green protocol for the synthesis of tetra-substituted imidazoles catalyzed by zeolite BEA: effect of surface acidity and polarity of zeolite

*Corresponding authors

Abstract

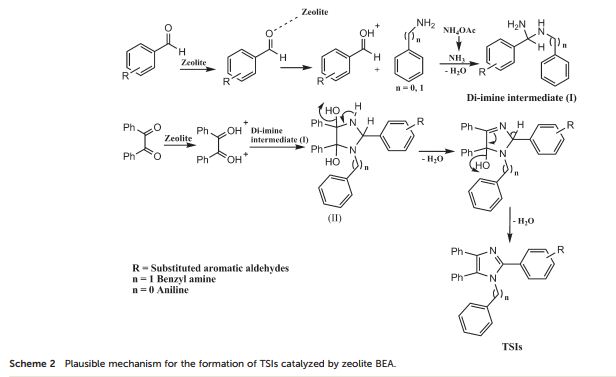
In the present study, the catalytic activity of various medium (H-ZSM-5) and large pore (H-BEA, H-Y, H-MOR) zeolites were studied as solid acid catalysts. The zeolite H-BEA is found to be an efficient catalyst for the synthesis of 1-benzyl-2,4,5-triphenyl-1H-imidazoles through one-pot, 4-component reaction (4-CR) between benzil, NH4OAc, substituted aromatic aldehydes and benzyl amine. The hydrophobicity, Si/Al ratio and acidic properties of zeolite BEA were well improved by controlled dealumination. The synthesized materials were characterized by various characterization techniques such as XRD, ICP-OES, BET, NH3-TPD, FT-IR, pyridine FT-IR, 27Al and 1H MAS NMR. It has been observed that the dealumination of the parent zeolite H-BEA (12) results in the enhanced strength of Brønsted acidity up to a certain Si/Al ratio which is attributed to the inductive effect of Lewis acidic EFAl species, leading to the higher activity of the zeolite BEA (15) catalyst towards the synthesis of 1-benzyl-2,4,5-triphenyl-1H-imidazoles under thermal solvent-free conditions with good to excellent yields. Using the present catalytic synthetic protocol, diverse tetra-substituted imidazoles, which are among the significant biologically active scaffolds, were synthesized in high yield within a shorter reaction time. The effect of polarity, surface acidity and extra framework Al species of the catalysts has been well demonstrated by means of pyridine FT-IR, and 27Al and 1H MAS NMR. The solvent-free synthetic protocol makes the process environmentally benign and economically viable.
Graphical abstract: An efficient green protocol for the synthesis of tetra-substituted imidazoles catalyzed by zeolite BEA: effect of surface acidity and polarity of zeolite
STR1
STR1
Image result for S. V. National Institute of Technology, Ichchhanath, Surat
S. V. National Institute of Technology, Ichchhanath, Surat
Image result for Mandvi Science College, Mandvi – 394160, Surat, India
Mandvi Science College, Mandvi – 394160, Surat, India
////////

DISCLAIMER

“ORGANIC SPECTROSCOPY INT” CATERS TO EDUCATION GLOBALLY, No commercial exploits are done or advertisements added by me. This is a compilation for educational purposes only. P.S. : The views expressed are my personal and in no-way suggest the views of the professional body or the company that I represent

Tuesday 31 October 2017

2,4-Diphenyl-2,3-dihydro-1,5-benzothiazepine

str1
2,4-Diphenyl-2,3-dihydro-1,5-benzothiazepine (4a) 1,3-Diphenyl-2-propen-1-one (1a).
Yellow solid; mp 114-116 C [lit.1 , 114-115 °C], AcOEt/PE 1:9.
1H NMR (300 MHz, CDCl3,): 3.07 (t, J = 12.6 Hz, 1 H), 3.32 (dd, J = 4.7, 13.1 Hz, 1 H), 4.99 (dd, J = 4.5, 12.0 Hz, 1 H), 7.12-7.17 (m, 1 H), 7.25-7.30 (m, 5 H), 7.44-7.51 (m, 4 H), 7.62 (d, J = 6.1 Hz, 2 H), 8.06 (d, J = 7.5 Hz, 2 H).
Isolated Yield: 339 mg, 86%
str2
2-(4-Hydroxyphenyl)-4-phenyl-2,3-dihydro-1,5-benzothiazepine (4e) 3-(4-Hydroxyphenyl)-1-phenyl-2-propen-1-one (1e).
Light brown solid; mp 131-134 °C. AcOEt/PE 40:60.
1H NMR (CDCl3, 300 MHz):  = 3.01 (t, J = 12.7 Hz, 1 H), 3.28 (dd, J = 4.8, 12.9 Hz, 1 H), 4.95 (dd, J = 4.7, 12.5 Hz, 1 H), 5.10 (bs, 1 H), 6.76 (d, J = 8.5 Hz, 2 H), 7.18-7.21 (m, 3 H), 7.35 (d, J = 8.5 Hz, 1 H), 7.46- 7.55 (m, 4 H), 7.63 (dd, J =1.5, 7.7 Hz, 1 H), 8.06 (m, 2 H).
13C NMR (CDCl3, 75 MHz): 37.99 (CH2), 60.07 (CH), 115.53 (CH), 123.08 (C), 127.40 (CH), 128.79 (CH), 131.17 (CH), 136.54 (C), 141.59 (C), 155.24 (C). IR (KBr): 1599, 2921, 3350 cm-1 .
MS (ESI): m/z= 332.24 (MH)+ . Anal. Calcd. for C21H17NOS: C, 76.10; H, 5.17; N, 4.23, found: C, 76.21; H, 5.15; N, 4.24. Isolated Yield: 360 mg, 87%


A practical synthesis of 2,3-dihydro-1,5-benzothiazepines

Green Chem., 2017, Accepted Manuscript
DOI: 10.1039/C7GC02097J, Paper
Domenico Carlo Maria Albanese, nicoletta gaggero, Meng Fei
2,3-Dihydro-1,5-benzothiazepines have been obtained through a domino process involving a Michael addition of 2-aminothiophenols to chalcones, followed by in situ cyclization. Up to 98% chemical yields have been obtained at...

A practical synthesis of 2,3-dihydro-1,5-benzothiazepines


Abstract

2,3-Dihydro-1,5-benzothiazepines have been obtained through a domino process involving a Michael addition of 2-aminothiophenols to chalcones, followed by in situ cyclization. Up to 98% chemical yields have been obtained at room temperature under essentially neutral conditions by using hexafluoro-2-propanol as an efficient medium.
/////////////////

Sunday 29 October 2017

Saturday 28 October 2017

(S)-2-(4-Chlorobenzoyl)-1,2,3,4-tetrahydrobenzo[e]pyrazino[1,2-a][1,4]diazepine-6,12(11H,12aH)-dione—Synthesis and Crystallographic Studies

Molbank 2017 m964 sch001


Synthesis of the (S)-2-(4-Chlorobenzoyl)-1,2,3,4-tetrahydrobenzo[e]pyrazino[1,2-a][1,4]diazepine-6,12(11H,12aH)-dione (4)

(S)-piperazine-2-carboxylic acid dihydrochloride (5, 700 mg, 3.45 mmol, 1 equiv.) was dispersed in 50 mL of 1:1 water:dioxane mixture and treated with sodium hydroxide (276 mg, 6.89 mmol, 2 equiv.). After dissolution of the starting material, 4-chlorobenzoyl chloride (6, 0.49 mL, 3.79 mmol, 1.1 equiv.) was added and reaction mixture was stirred in room temperature for 18 h. The next day, the disappearance of starting material and formation of (S)-4-(4-chlorobenzoyl)piperazine-2-carboxylic acid (7) was confirmed by LRMS-ESI spectra. Then, isatoic anhydride (8, 1.69 g, 10.34 mmol, 3 equiv.) was added, followed by addition of sodium carbonate (1.10 g, 10.34 mmol, 3 equiv.); the reaction mixture was heated in 60 °C for 18 h. The following day, formation of the (S)-1-(2-aminobenzoyl)-4-(4-chlorobenzoyl)piperazine-2-carboxylic acid 9 was confirmed by LRMS-ESI spectra. The volatiles were evaporated under reduced pressure, then the residue was co-evaporated with toluene (3 × 50 mL) and dissolved in dry DMF. For cyclization of 9, HATU (3.93 g, 10.34 mmol, 3 equiv.) and DIPEA (1.80 mL, 10.34 mmol, 3 equiv.) were added, and reaction mixture was stirred in room temperature for 18 h. The day after, the volatiles were evaporated under reduced pressure and residue was dissolved in water:ethyl acetate biphasic system. The organic phase was washed with water (2 × 50 mL), 0.5 M HCl (3 × 50 mL), saturated sodium bicarbonate (1 × 50 mL), and dried over magnesium sulphate. The crude product dissolved in ethyl acetate was evaporated with silica gel (2 g) and purified by column chromatography using hexane:ethyl acetate 2:8 v/v mixture, followed by pure ethyl acetate. Yield: 711 mg (56%). 1H-NMR (500 MHz, DMSO-d6): 10.55, 10.45 (2 × s, 2 × NH); 7.80–7.70 (m, 1H, HAr); 7.70–7.40 (m, 5H, HAr); 7.30–7.20 (m, 1H, HAr); 7.20–7.00 (m, 1H, HAr); 4.45–3.30 (m, 7H, 3 × CH2, 1 × CH); 13C-NMR (125 MHz, DMSO-d6): 170.5, 169.5, 166.6, 136.6, 135.0, 134.2, 132.3, 130.9, 129.3, 129.0, 128.5, 128.3, 125.6, 124.0, 120.9, 51.7, 42.7, 42.2, 38.2; HRMS (ESI): m/z [M + H]+ calcd. for C19H17ClN3O3: 370.09530, 372.09235, found: 370.09517, 372.09206; m.p. 248–250 °C.  = +290 (c 1.0, DMSO). IR (KBr): cm−1 3465, 3369, 3229, 3160, 3109, 3068, 2909, 2866, 1694, 1657, 1620, 1521, 1477, 1431, 1407, 1339, 1303, 1262, 1219, 1181, 1162, 1092, 1035, 1010.


Molbank 20172017(4), M964; doi: 10.3390/M964
Communication
(S)-2-(4-Chlorobenzoyl)-1,2,3,4-tetrahydrobenzo[e]pyrazino[1,2-a][1,4]diazepine-6,12(11H,12aH)-dione—Synthesis and Crystallographic Studies
Adam Mieczkowski 1,*, Damian Trzybiński 2, Marcin Wilczek 3, Mateusz Psurski 4Orcid, Maciej Bagiński 1,3, Bartosz Bieszczad 1,3, Magdalena Mroczkowska 1,3 and Krzysztof Woźniak 2
1
Institute of Biochemistry and Biophysics Polish Academy of Sciences, Pawinskiego 5a, 02-106 Warsaw, Poland
2
Biological and Chemical Research Centre, University of Warsaw, Żwirki i Wigury 101, 02-089 Warsaw, Poland
3
Faculty of Chemistry, University of Warsaw, Pasteura 1, 02-093 Warsaw, Poland
4
Institute of Immunology and Experimental Therapy, Polish Academy of Sciences, 12 R. Weigl, 53-114 Wroclaw, Poland
*
Correspondence: Tel.: +48-22-592-35-06; Fax: +48-22-592-21-90
Received: 12 October 2017 / Accepted: 25 October 2017 / Published: 27 October 2017

Abstract

: 
(S)-2-(4-Chlorobenzoyl)-1,2,3,4-tetrahydrobenzo[e]pyrazino[1,2-a][1,4]diazepine-6,12(11H,12aH)-dione was obtained in a three-step, one-pot synthesis, starting from optically pure (S)-2-piperazine carboxylic acid dihydrochloride. Selective acylation of the β-nitrogen atom followed by condensation with isatoic anhydride and cyclization with HATU/DIPEA to a seven-member benzodiazepine ring, led to the tricyclic benzodiazepine derivative. Crystallographic studies and initial biological screening were performed for the title compound.

Keywords:
 (S)-2-piperazinecarboxylic acid; tricyclic benzodiazepines; isatoic anhydride; cytotoxicity

http://www.mdpi.com/1422-8599/2017/4/M964/htm
file:///C:/Users/Inspiron/Downloads/molbank-2017-M964-s002.pdf


/////////

Ethyl-2-butenoate

Abstract

For the last fifty years nuclear magnetic resonance spectroscopy, generally referred as NMR, is one of the most versatile techniques for elucidation of structure of organic compounds. Among all available spectrometric methods, NMR is the only technique which offers a complete analysis and interpretation of the entire spectrum. Due to improved experimental technology and novel approaches, over the last decade nuclear magnetic resonance (NMR) has shown a tremendous progress. Generally, NMR spectroscopy makes use of three approaches; those are one dimension (1D), two dimensions (2D) and three dimensions (3D). Usually, the first approach of 1D-NMR (1H DEPT, 13C, 15N, 19F, 31P, etc.) generates good information about the structure of simple organic compounds, but in case of larger molecules the 1D-NMR spectra are generally overcrowded. Hence, the second approach of 2D-NMR (COSY, DQFCOSY, MQFCOSY, HETCOR, HSQC, HMQC, HMBC, TOCSY, NOESY, EXSY, etc.) is used for the further larger molecules, but 2D-NMR spectra also becomes complex and overlapping when used for further very large molecules like proteins. Hence, so as to achieve high resolution and reduced overlapping in spectra of very large molecules, Multi Dimensional-NMR (Homonuclear and Heteronuclear) are generally used. This paper supports interpretation of structure of different organic compounds by different NMR techniques.


Image result for nmr examples solutions


13C-NMR proton decoupled spectrum of Ethyl-2-butenoate in CDCl3.


DEPT spectrum of Ethyl-2-butenoate.


COSY


https://www.omicsonline.org/structural-elucidation-of-small-organic-molecules-by-1d-2d-and-multi-dimensional-solution-nmr-spectroscopy-2155-9872.S11-001.php?aid=12051&view=mobile
//////////

Structural Elucidation of Small Organic Molecules by 1D, 2D and Multi Dimensional-Solution NMR Spectroscopy

Neeraj Kumar Fuloria* and Shivkanya Fuloria
Anuradha College of Pharmacy, Amravati University, Maharashtra, India
*Corresponding Author:
Dr. Neeraj Kumar Fuloria 
M.Pharm (Pharmaceutical Chemistry)
Head, M.Pharm (Quality Assurance)
Anuradha College of Pharmacy
Chikhli, Buldhana, Maharashtra, India
Tel: 8805680423
E-mail: nfuloria@gmail.com, nfuloria@rediffmail.com
Received date: January 10, 2013; Accepted date: January 30, 2013; Published date: February 07, 2013
Citation: Fuloria NK, Fuloria S (2013) Structural Elucidation of Small Organic Molecules by 1D, 2D and Multi Dimensional-Solution NMR Spectroscopy. J Anal Bioanal Tech S11:001. doi: 10.4172/2155-9872.S11-001
Copyright: © 2013 de Francisco TMG, et al. This is an open-access article distributed under the terms of the Creative Commons Attribution License, which permits unrestricted use, distribution, and reproduction in any medium, provided the original author and source are credited.

13C NMR OF PHENYL PROPIONATE

Image result for nmr examples solutions

The NMR Spectrum of Iodoethane CH3CH2I

Higher frequency
The CH3 protons produce a peak at δ 1.8 but, instead of a single peak, a triplet is produced. This is because the CH3 protons couple with the adjacent two CH2 protons.
The CH2 protons produce a peak at δ 3.2 but, instead of a single peak, a quartet is produced. This is because the CH2 protons couple with the adjacent three CH3protons.
In general, if there are 'n' protons three bonds away from the resonating group, the absorption will be split into a multiplet of n+1 lines.

2-propen-1-ol

Image result for nmr examples solutions

HR-MAS NMR Spectroscopy in Material Science

Schematic of a HR-MAS stator with a magic angle gradient along the rotor spinning axis. 


The gradient 2D 1 H HR-MAS NMR COSY spectrum for the ionic liquid [MBPyrr] + [TFSI] - 


Image result for nmr examples solutions


The 1 H HR-MAS NMR of the ionic liquid [MBPyrr] + TFSI - at 298K as a A) neat liquid and B)


Pictorial representation of the gradient produced along the magic angle of the rotor. B) The decay of two different water signals found in a 1N methanol solution of an AEM membrane with increasing gradient strength. Gradient strength values (G/cm) are shown above the stack plot. 


//////

13C-NMR spectroscopy

The basics of 13C-NMR spectroscopy

The magnetic moment of a 13C nucleus is much weaker than that of a proton, meaning that NMR signals from 13C nuclei are inherently much weaker than proton signals.  This, combined with the low natural abundance of 13C, means that it is much more difficult to observe carbon signals: more sample is required, and often the data from hundreds of scans must be averaged in order to bring the signal-to-noise ratio down to acceptable levels. Unlike 1H-NMR signals, the area under a 13C-NMR signal cannot be used to determine the number of carbons to which it corresponds.  This is because the signals for some types of carbons are inherently weaker than for other types – peaks corresponding to carbonyl carbons, for example, are much smaller than those for methyl or methylene (CH2) peaks. Peak integration is generally not useful in 13C-NMR spectroscopy, except when investigating molecules that have been enriched with 13C isotope (see section 5.6B).
The resonance frequencies of 13C nuclei are lower than those of protons in the same applied field - in a 7.05 Tesla instrument, protons resonate at about 300 MHz, while carbons resonate at about 75 MHz.  This is fortunate, as it allows us to look at 13C signals using a completely separate 'window' of radio frequencies. Just like in 1H-NMR, the standard used in 13C-NMR experiments to define the 0 ppm point is tetramethylsilane (TMS), although of course in 13C-NMR it is the signal from the four equivalent  carbons in TMS that serves as the standard.  Chemical shifts for 13C nuclei in organic molecules are spread out over a much wider range than for protons – up to 200 ppm for 13C compared to 12 ppm for protons  This is also fortunate, because it means that the signal from each carbon in a compound can almost always be seen as a distinct peak, without the overlapping that often plagues 1H-NMR spectra. The chemical shift of a 13C nucleus is influenced by essentially the same factors that influence a proton's chemical shift: bonds to electronegative atoms and diamagnetic anisotropy effects tend to shift signals downfield (higher resonance frequency). In addition, sp2 hybridization results in a large downfield shift.  The 13C-NMR signals for carbonyl carbons are generally the furthest downfield (170-220 ppm), due to both sp2 hybridization and to the double bond to oxygen.

Because of the low natural abundance of 13C nuclei, it is very unlikely to find two 13C atoms near each other in the same molecule, and thus we do not see spin-spin coupling between neighboring carbons in a 13C-NMR spectrum. There is, however, heteronuclear coupling between 13C carbons and the hydrogens to which they are bound.  Carbon-proton coupling constants are very large, on the order of 100 – 250 Hz.  For clarity, chemists generally use a technique called broadband decoupling, which essentially 'turns off'  C-H  coupling, resulting in a spectrum in which all carbon signals are singlets. Below is the proton-decoupled13C-NMR spectrum of ethyl acetate, showing the expected four signals, one for each of the carbons.

image104.png
While broadband decoupling results in a much simpler spectrum, useful information about the presence of neighboring protons is lost. However, another modern NMR technique called DEPT (Distortionless Enhancement by Polarization Transfer) allows us to determine how many hydrogens are bound to each carbon. For example, a DEPT experiment tells us that the signal at 171 ppm in the ethyl acetate spectrum is a quaternary carbon (no hydrogens bound, in this case a carbonyl carbon), that the 61 ppm signal is from a methylene (CH2) carbon, and that the 21 ppm and 14 ppm signals are both methyl (CH3) carbons. The details of the DEPT experiment are beyond the scope of this text, but DEPT information will often be provided along with 13C spectral data in examples and problems.
Below are two more examples of 13C NMR spectra of simple organic molecules, along with DEPT information.
image106.png


Image result for 13C-NMR spectroscopy benzene


Image result for 13C-NMR spectroscopy benzene


image108.png


One of the greatest advantages of 13C-NMR compared to 1H-NMR is the breadth of the spectrum - recall that carbons resonate from 0-220 ppm relative to the TMS standard, as opposed to only 0-12 ppm for protons. Because of this, 13C signals rarely overlap, and we can almost always distinguish separate peaks for each carbon, even in a relatively large compound containing carbons in very similar environments. In the proton spectrum of 1-heptanol, for example, only the signals for the alcohol proton (Ha) and the two protons on the adjacent carbon (Hb) are easily analyzed.  The other proton signals overlap, making analysis difficult. 
image110.png
In the 13C spectrum of the same molecule, however, we can easily distinguish each carbon signal, and we know from this data that our sample has seven non-equivalent carbons. (Notice also that, as we would expect, the chemical shifts of the carbons get progressively smaller as they get farther away from the deshielding oxygen.)
image112.png
This property of 13C-NMR makes it very helpful in the elucidation of larger, more complex structures.


//////////////////////