DR ANTHONY MELVIN CRASTO,WorldDrugTracker, helping millions, A 90 % paralysed man in action for you, I am suffering from transverse mylitis and bound to a wheel chair, With death on the horizon, nothing will not stop me except God................DR ANTHONY MELVIN CRASTO Ph.D ( ICT, Mumbai) , INDIA 25Yrs Exp. in the feld of Organic Chemistry,Working for GLENMARK GENERICS at Navi Mumbai, INDIA. Serving chemists around the world. Helping them with websites on Chemistry.Million hits on google, world acclamation from industry, academia, drug authorities for websites, blogs and educational contribution

Saturday, 2 January 2016

Terretrione D

.

Terretrione D
Key COSY and HMBC correlations of 2.


Figure 1. Structures of Compounds 16.
Marinedrugs 13 01698 g001 1024

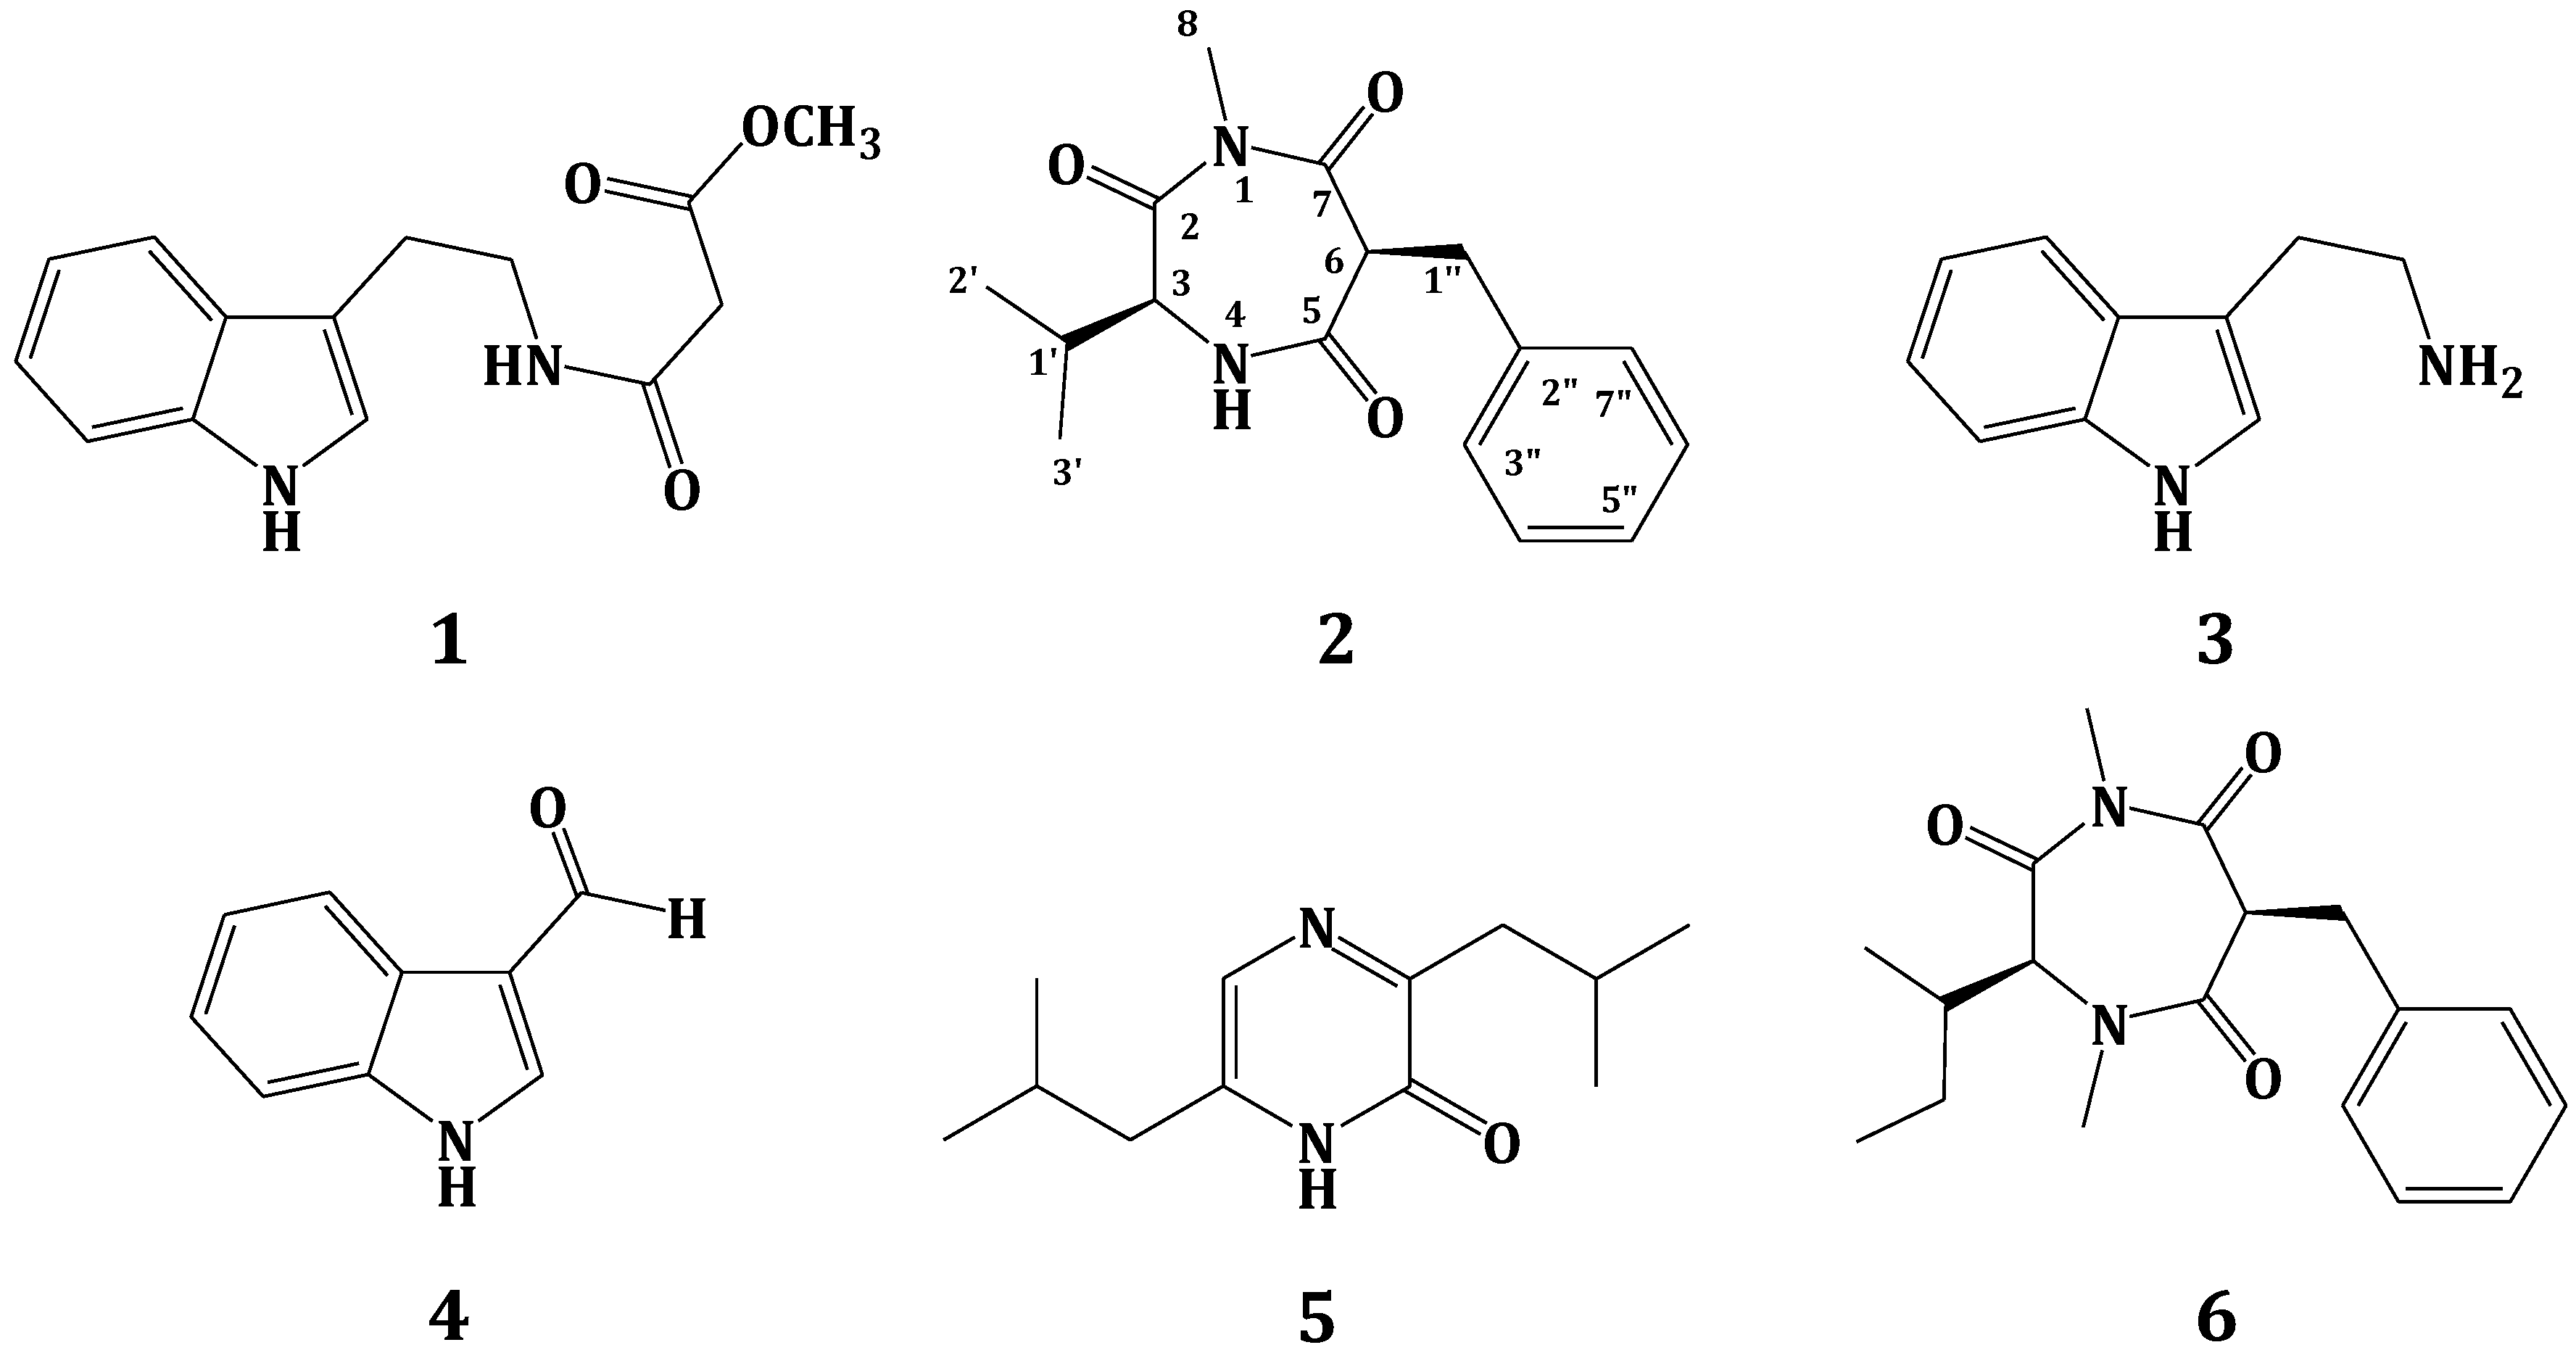
methyl-2-([2-(1H-indol-3-yl)ethyl]carbamoyl)acetate (1),
Terretrione D (2)
tryptamine (3),
indole-3-carbaldehyde (4),
3,6-diisobutylpyrazin-2(1H)-one (5) and
terretrione C (6),


Table 1. NMR data of Compound 2 (CD3OD, 600 and 150 MHz).
PositionδC, Type aδH, m (J in Hz)HMBCNOESY
2173.0, C b
360.1, CH4.18, d (4.8)C-2, C-5, C-1′H-6, H3-8, H-1′
5173.2, C
656.4, CH4.68, dd (8.4, 6.6)C-5, C-7, C-1″H-3, H3-8, H2-1″
7173.1, C b
822.9, CH31.90, sC-2, C-7
1′32.2, CH2.07, mC-2, C-3, C-2′, C-3′H-3
2′19.8, CH30.81, d (7.2)C-1′, C-3
3′18.2, CH30.78, d (7.2)C-1′, C-3
1″39.0, CH23.11, dd (13.8, 6.6)
2.88, dd (13.8, 8.4)
C-2″, C-3″, C-6, C-7H-6
2″138.6, C
3″130.2, CH7.23, mC-2″, C-5″
4″129.4, CH7.24, mC-2″
5″127.7, CH7.14, mC-3″, C-7″
6″129.4, CH7.24, mC-2″
7″130.2, CH7.23, mC-1″, C-5″
a Multiplicities were deduced by DEPT and HSQC; b signals may be interchangeable.
  
compound 2 (Figure 1) showed a molecular formula C16H20N2O3, as deduced from the HRESIMS pseudomolecular ion peak at m/z 289.1555 [M + H]+, requiring eight degrees of unsaturation. The 13C NMR spectrum revealed signals for 16 carbons. Careful investigation of the 1H, 13C and 2D NMR spectra supported the presence of a valine residue in 2. This was evident from the NMR signals at δHC 0.81 (3H, d, J = 7.2 Hz, H3-2′)/19.8 (C-2′), 0.78 (3H, d, J = 7.2 Hz, H3-3′)/18.2 (C-3′), 2.07 (1H, m, H-1′)/32.2 (C-1′), 4.18 (1H, d, J = 4.8 Hz, H-3)/60.1 (C-3) and δC 173.0 (C-2). In addition, signals for a 2-benzylmalonamide moiety were observed. The signals at δC 138.6 (C-2″), δHC 7.23 (2H, m)/130.2 (C-3″,7″), 7.24 (2H, m)/129.4 (C-4″,6″) and 7.14 (1H, m)/127.7 (C-5″) supported the existence of a phenyl group. In addition, the coupled signals at δH 3.11 (1H, dd, J = 13.8, 6.6 Hz, H-1″a) and 2.88 (1H, dd, J = 13.8, 8.4 Hz, H-1″b) showed vicinal coupling to the signal at δH 4.68 (1H, dd, J = 8.4, 6.6 Hz, H-6) in the 1H,1H-COSY spectrum. Furthermore, the two amidic carbonyls (C-5 and C-7) of the 2-benzylmalonamide moiety resonate at δC 173.2 and 173.1. Finally, a three-proton singlet at δH 1.90, which correlates with the 13C signal at δC 22.9, was assigned to a methyl group linked to N-1. The linkage of the valine residue with the 2-benzylmalonamide moiety through N-1 and N-4 was supported by the HMBC correlations of H-3/C-5, H-3/C-2, H3-8/C-2 (δC 173.0) and H3-8/C-7 (δC 173.1). The HMBC correlations of H3-8 to C-2 and C-7 secured the placement of the N-methyl at N-1. Additional HMBC correlations within the valine and the 2-benzylmalonamide moieties (Table 1 and Figure 2) confirmed the assignment of all carbon signals and completing the flat structure of 2. The absolute configuration of the chiral center at C-3 of the valine residue was established by analysis of the degradation product of 2. A small amount of 2 was hydrolyzed with 6N HCl to give valine residue, which was analyzed by chiral HPLC, and its retention time was compared with the retention times of authentic standards (d- and l-valine). The amino acid in 2 was determined as l-valine. In addition, the relative configuration of C-6 was determined as 6S*, since the NOESY spectrum (Table 1) exhibited a strong correlation between H-3 (δH 4.18) and H-6 (δH 4.68). The MM2 ChemBio3D Ultra 14.0 (ChemBioOffice® Ultra 14.0) energy minimized drawing for Compound 2 was also created and supports a significant NOESY correlation between H-3 and H-6 (Figure 3). Therefore, 2 was assigned as (3S,6S)-6-benzyl-3-isopropyl-1-methyl-1,4-diazepane-2,5,7-trione and named terretrione D. Terretrione D possesses the 1,4-diazepane skeleton, which was previously reported in terretriones A–C. These compounds were reported from the marine fungus Aspergillus terreus [18]. It is worth mentioning that terretrione D is 4-demethylterretrione B, and the NMR data of 2 are comparable with those of terretrione B [18]. Compound 2 is reported here for the first time from a natural source, and therefore, it is considered as a new natural product.
The known compounds were identified by extensive study of their spectral data, including HRESIMS, 1D and 2D NMR data, as well as by comparison with the available data in the literature. Thus, the compounds were identified as methyl-2-([2-(1H-indol-3-yl)ethyl]carbamoyl)acetate (1) [16], tryptamine (3), indole-3-carbaldehyde (4), 3,6-diisobutylpyrazin-2(1H)-one (5) [17] and terretrione C (6) [18]. The amino acid residue of compound 6 was also determined as N-methyl-l-isoleucine by HPLC chiral analysis of the hydrolysate of 6 (see Section 3.6). Furthermore, the relative configuration of its C-6 was assigned as 6S* by the NOESY correlation, similar to that described for 2.


Terretrione D (2): White amorphous powder; [α]D −65.7 (c 1.5, MeOH); UV (MeOH) λmax (log ε) 314 (2.65) nm; IR νmax (film) 3367, 1682, 1630, 1540, 1455, 1288, 1094, 702 cm−1; NMR data, see Table 1; HRESIMS m/z 289.1555 (calcd. for C16H21N2O3, [M + H]+, 289.1552).
 see
 http://www.mdpi.com/1660-3397/13/4/1698


Mar. Drugs 2015, 13(4), 1698-1709; doi:10.3390/md13041698
Article

Identification and Bioactivity of Compounds from the Fungus Penicillium sp. CYE-87 Isolated from a Marine Tunicate


1 Natural Products Unit, King Fahd Medical Research Center, King Abdulaziz University, Jeddah 21589, Saudi Arabia 2 Suez Canal University Hospital, Suez Canal University, Ismailia 51522, Egypt 3 Department of Natural Products, Faculty of Pharmacy, King Abdulaziz University, Jeddah 21589, Saudi Arabia
////////////

Pestalafuranone A

.

  Pestalafuranone A (1).


Figure 2. Structures of compounds 15.
Molecules 17 14015 g002 1024.
 

Table 1. 1H-NMR Data for 13, 5 in CDCl3 and 4 in acetone-d6.
Position1 a2 a3 a4 a5 a
54.65, s4.85, s4.63, s4.78, s4.78, d (17)
4.71, d (17)
66.10, d (16)6.26, d (16)2.45, t (7.5)6.24, d (16)2.61, t (7.5)
76.86, m6.97, m1.52, m6.85, m1.55, m
81.86, d (7.0)1.89, d (6.7)0.93, t (7.5)1.81, d (6.5)0.94, t (7.5)
92.70, m6.77, d (16)2.67, br s2.90, dd (15, 3.6)2.86, dd (12, 4.0)
2.65, dd (15, 6.0)2.44, dd (12, 7.0)
102.70, m6.04, dd (16, 7.7)2.67, br s2.77, m2.75, ddd (7.0, 4.0, 2.0)
114.52, m2.85, dq (4.5, 2.0)2.81, dq (7.5, 2.0)
11-OH1.75, br s
122.18, s1.68, d (7.0)2.19, s1.24, d (4.5)0.93, d (7.5)

Table 2. 13C-NMR data for 13, 5 in CDCl3 and 4 in acetone-d6.
Position1 a2 a3 a4 a5 a
2172.9, qC173.0, qC 177.5, qC173.0, qC174.5, qC
3123.3, qC122.7, qC127.9, qC123.9, qC128.7, qC
4156.6, qC149.4, qC158.9, qC156.3, qC158.5, qC
570.8, CH268.6, CH271.2, CH271.7, CH271.8, CH2
6118.1, CH118.7, CH25.6 CH2119.9, CH25.6, CH2
7133.0, CH134.3, CH20.6 CH2132.3, CH21.4, CH2
819.3, CH319.6, CH313.9, CH317.4, CH313.9, CH3
920.4, CH2118.6, CH 21.3, CH230.2, CH229.9 CH2
1041.0, CH2140.8, CH41.3, CH257.2, CH56.8, CH
11206.1, qC68.3, CH206.0, qC54.7, CH54.5, CH
1229.8, CH323.5, CH329.8, CH319.1, CH317.2, CH3

Extraction and Isolation

The fermented material was freeze-dried and extracted with methyl ethyl ketone (3 × 500 mL), and the organic solvent was evaporated to dryness under vacuum to afford 5.0 g of crude extract. The extract was fractionated by silica gel column chromatography (5 × 40 cm) using CHCl3–CH3OH gradient elution. The fraction (50 mg) that was eluted with 1% MeOH was further separated by semipreparative reversed-phase HPLC (Kramosil C18 column; 10-µm; 10 × 250 mm, 2 mL/min) to afford pestalafuranone B (2; 1.9 mg, tR 15.3 min; 50% MeOH in H2O over 2 min, 50–72% over 10 min, 72–74% over 13 min). The fraction (180 mg) that was eluted with 2% MeOH was then separated by Sephadex LH-20 column chromatography (CH2Cl2n-C6H14 = 4:1) to afford six fractions. Fraction 3 (60 mg) was successively separated by semipreparative reversed-phase HPLC (32% MeOH in H2O over 2 min, 32–55% over 60 min) afforded pestalafuranones A (1; 1.6 mg, tR 25.7 min), C (3; 6.0 mg, tR 26.6 min), D (4; 1.5 mg, tR 30.0 min), and E (5; 3.5 mg, tR 31.5 min).
Pestalafuranone A (1): colorless oil; UV (CH3OH) λmax 272 (ε 7800), 265 (ε 6600) nm; IR (Neat) νmax 2962, 1748, 1717, 1448, 1364 cm−1; 1H- and 13C-NMR data, see Table 1 and Table 2; HRESIMS obsd. m/z 217.0840 [M+Na]+ (calcd for C11H14O3Na, 217.0835).


Pestalafuranone B (2): pale yellow oil; [α]D −16 (c 0.05, CH3OH); UV (CH3OH) λmax 270 (ε 3300) nm; IR (Neat) νmax 3403 (br), 2932, 1749, 1446 cm−1; 1H- and 13C-NMR data, see Table 1 and Table 2; HRESIMS obsd. m/z 217.0842 [M+Na]+ (calcd for C11H14O3Na, 217.0835).
Pestalafuranone C (3): pale yellow oil; UV (CH3OH) λmax 265 (ε 6600), 235 (ε 4300) nm; IR (Neat) νmax 2919, 1752, 1717, 1445, 1365 cm−1; 1H- and 13C-NMR data, see Table 1 and Table 2; HRESIMS obsd. m/z 219.0998 [M+Na]+ (calcd for C11H16O3Na, 219.0992).
Pestalafuranone D (4): colorless oil; [α]D +32 (c 0.05, CH3OH); UV (CH3OH) λmax 275 (ε 4460) nm; IR (Neat) νmax 2963, 1751, 1450, 1381 cm−1; 1H- and 13C-NMR data, see Table 1 and Table 2; HRESIMS obsd. m/z 217.0846 [M+Na]+ (calcd for C11H14O3Na, 217.0835).
Pestalafuranone D (5): colorless oil; [α]D +16 (c 0.05, CH3OH); UV (CH3OH) λmax 275 (ε 6270) nm; IR (Neat) νmax 2931, 1753, 1446, 1346 cm−1; 1H- and 13C-NMR data, see Table 1 and Table 2; HRESIMS obsd. m/z 219.0995 [M+Na]+ (calcd for C11H16O3Na, 219.0992).
 SEE

Molecules 2012, 17(12), 14015-14021; doi:10.3390/molecules171214015
Article
New Furanones from the Plant Endophytic Fungus Pestalotiopsis besseyi
Haitao Liu 1, Shuchun Liu 2,3, Liangdong Guo 3, Yonggang Zhang 4, Langjun Cui 5 and Gang Ding 1,*
1
Key Laboratory of Bioactive Substances and Resources Utilization of Chinese Herbal Medicine, Ministry of Education, Institute of Medicinal Plant Development, Chinese Academy of Medical Sciences and Peking Union Medical College, Beijing 100193, China
2
Graduate School of Chinese Academy of Sciences, Beijing 100086, China
3
Institute of Microbiology, Beijing 100086, China
4
Biotechnology Center of Shandong Academy of Sciences, Jinan 250014, Shandong, China
5
College of Life Science, Shaanxi Normal University, Xi’an 710062, Shaanxi, China
*
Author to whom correspondence should be addressed; Email: Tel.: +86-010-5783-3281; Fax: +86-010-5783-3290.


Key Laboratory of Bioactive Substances and Resources Utilization of Chinese Herbal Medicine, Ministry of Education, Institute of Medicinal Plant Development, Chinese Academy of Medical Sciences and Peking Union Medical College, Beijing 100193, China


//////

COSY, HSQC, HMBC, NOESY

Das COSY (COrrelated SpectroscopY)-Experiment

Das COSY-Experiment ist das älteste und wohl bekannteste (verschiebungskorrelierte) 2D-Verfahren.
Ziel ist es, auf der skalaren Spin-Spin-Kopplung (über Bindungen) beruhende Beziehungen zwischen Kernen aufzudecken.
Besonders sinnvoll ist die Aufnahme eines COSY-Spektrums, wenn im 1D-NMR-Spektrum überlappende Multipletts und Teilspektren höherer Ordnung auftreten.

COSY-Impulsfolgen

Es gibt viele verschiedene COSY-Pulssequenzen, man kann auch zwischen heteronuclearen (z.B. C,H-COSY) und homonuclearen COSY-Spektren (z.B. H,H-COSY) unterscheiden.
Das gängigste Verfahren ist das H,H-COSY-Experiment, was im folgenden näher erläutert wird.
In seiner einfachsten Form besteht das COSY-Experiment aus zwei 90°-Impulsen, die nur durch die Evolutionszeit t1 getrennt sind:

Abb.1

Das H,H-COSY-Spektrum

Im H,H-COSY-Spektrum sind auf beiden Achsen die 1H -chemischen Verschiebungen aufgetragen; prinzipiell sind auf beiden Achsen die 1H -NMR-Spektren zu sehen. Es ergibt sich also ein zur Diagonalen symmetrisches Diagramm.
1H-NMR-Spektrum von Acetylsalicylsäure

Abb.2
H,H-COSY-Spektrum von Acetylsalicylsäure
Im Spektrum ist nur der Bereich zwischen 7,0 und 8,2 ppm aufgetragen, da nur hier skalare H-H-Kopplungen zu erwarten sind.

Abb.3
Man unterscheidet zwei Arten von Signalen:
  • Diagonalsignale: treten bei den Koordinaten δaδa (bei Kern A), δbδb (bei Kern B)...auf, die aber für die Auswertung der Kopplungen zwischen verschiedenen Kernen keine Rolle spielen, da es sich hierbei nur um das Signal eines Kerns handelt. Die Diagonale mit all ihren Signalen entspricht dem 1D-H-NMR-Spektrum.
Beispiel
Acetylsalicylsäure
7,13 ppm/7,13 ppm = δ2δ2 (H-Atom 2)
7,34 ppm/7,34 ppm = δ4δ4 (H-Atom 4)
7,61 ppm/7,61 ppm = δ3δ3 (H-Atom 3)
8,11 ppm/8,11 ppm = δ5δ5 (H-Atom 5)
  • Kreuzsignale: Diese Signale beruhen auf der skalaren Spin-Spin-Kopplung und sind für die Spektrenauswertung von enormer Bedeutung.
Beispiel
Acetylsalicylsäure
7,13 ppm/7,61 ppm (δ2δ3 ) und 7,61 ppm/7,13 ppm (δ3δ2 ) - vicinale Kopplung zwischen den H-Atomen 2 und 3
7,34 ppm/7,61 ppm (δ4δ3 ) und 7,61 ppm/7,34 ppm (δ3δ4 ) - vicinale Kopplung zwischen den H-Atomen 4 und 3
7,34 ppm/8,11 ppm (δ4δ5 ) und 8,11 ppm/7,34 ppm (δ5δ4 ) - vicinale Kopplung zwischen den H-Atomen 4 und 5
Allgemein erkennt man im COSY-Spektrum jede skalare Kopplung zwischen zwei Kernen an vier Signalen (zwei Kreuz- und zwei Diagonalsignale), die verbunden ein Quadrat ergeben; im folgenden Beispiel ist die vicinale Kopplung zwischen den H-Atomen 3 und 4 hervorgehoben.

Abb.4
Bei guter Auflösung der COSY-Spektren können aus der Feinstruktur von Kreuz- und Diagonalsignalen die Kopplungskonstanten bestimmt werden, was jedoch selten gemacht wird, da dies einfacher aus 1D-H-NMR-Spektren möglich ist.

Das HSQC (Heteronuclear Single Quantum Coherence)-Experiment

Für die Strukturaufklärung von komplexen chemischen Verbindungen ist die Aufnahme von 2D-heteronuklear korrelierten NMR-Spektren (z.B. zwischen C und H bzw. N und H) von großer Wichtigkeit.
Die Aufnahme von Spektren unempfindlicher Kerne (z.B. C, N) ist im Allgemeinen jedoch sehr langwierig; daher werden normale heteronukleare 2D-Verfahren wie das C,H-COSY-Experiment durch inverse Verfahren (z.B. HSQC , HMBC1)) ersetzt, was zu einer drastischen Verkürzung der Messzeit führt. Bei inversen Aufnahmetechniken werden im Kanal der unempfindlichen Kerne (C, N) Kohärenzen erzeugt, die dann auf den empfindlichen Kern (meist 1H) übertragen werden, dessen Resonanzen dann gemessen werden.
Die HSQC-Spektren sind meist recht übersichtlich, da nur Signale von direkt gebundenen C (N...)- und H-Atomen erscheinen.

HSQC-Impulsfolge

Die HSQC-Impulsfolge ist sehr komplex und besteht sowohl im X-Kern-Kanal (C, N...) als auch im Protonen-Kanal aus einer Vielzahl von 90° - und 180°-Impulsen, die durch Zeiten τ und t1 getrennt sind.

Das HSQC-Spektrum

Im HSQC-Spektrum ist auf der x-Achse die 1H-chemische Verschiebung aufgetragen, auf der y-Achse die 13C-(15N-...) chemische Verschiebung. Das Spektrum setzt sich also prinzipiell aus einem H-NMR- und einem breitbandentkoppelten C-(N...)NMR-Spektrum zusammen.
1H- und 13C-NMR-Spektren von Acetylsalicylsäure
Hinweis
Die Nummern an den einzelnen Atomen der Strukturformel beziehen sich im 1H-NMR-Spektrum auf die H-Atome, im 13C-NMR-Spektrum auf die C-Atome.

Abb.1
HSQC-Spektrum von Acetylsalicylsäure
Im Folgenden ist das HSQC-Spektrum der Acetylsalicylsäure zu sehen. Der Bereich der chemischen Verschiebung wurde sowohl bei den Protonen als auch beim Kohlenstoff so gewählt, dass alle Signale des 2D-Spektrums sichtbar sind. Das Signal des Lösungsmittels CDCl3 wurde entfernt.

Abb.2
Im HSQC-Spektrum erscheinen fünf Signale:
21 ppm/2,4 ppm: Signal der CH3-Gruppe (C-H-Kopplung über eine Bindung)
124 ppm/7,1 ppm: Signale der aromatischen CH-Gruppen (Kopplung C-H über eine Bindung)126 ppm/7,3 ppm132 ppm/8,1 ppm 135 ppm/7,6 ppm
Zur besseren Anschaulichkeit ist im folgenden HSQC-Spektrum der Acetylsalicylsäure nur der Bereich dargestellt, in dem die Signale für die aromatischen C-H-Gruppen erscheinen.

Abb.3
 

Das HMBC (Heteronuclear Multiple Bond Correlation)-Experiment

Für die Strukturaufklärung von komplexen chemischen Verbindungen ist die Aufnahme von 2D-heteronuklear korrelierten NMR-Spektren (z.B. zwischen 13C und 1H bzw. 15N und 1H) von großer Wichtigkeit.
Die Aufnahme von Spektren unempfindlicher Kerne (z. B. 13C, 15N) ist im Allgemeinen jedoch sehr langwierig; daher werden normale heteronukleare 2D-Verfahren wie das C,H-COSY-Experiment durch inverse Verfahren (z.B. HSQC, HMBC ) ersetzt, was zu einer drastischen Verkürzung der Messzeit führt. Bei inversen Aufnahmetechniken werden im Kanal der unempfindlichen Kerne (13C, 15N) Kohärenzen erzeugt, die dann auf den empfindlichen Kern (meist 1H) übertragen werden, dessen Resonanzen dann gemessen werden.
In den HMBC-Spektren sind Korrelationen über mehrere Bindungen, z.B. zwischen 13C (15N...)- und 1H-Atomen sichtbar. Das HMBC-Experiment ist eins der empfindlichsten Verfahren für Weitbereichskorrelationen.

HMBC-Impulsfolge

Die HMBC-Impulsfolge besteht sowohl im X-Kern-Kanal (13C, 15N...) als auch im Protonen-Kanal aus mehreren 90° - und 180°-Impulsen, die durch Zeiten τ und t1 getrennt sind.

Das HMBC-Spektrum

Im HMBC-Spektrum ist auf der x-Achse die 1H-chemische Verschiebung aufgetragen, auf der y-Achse die 13C- (15N-...) chemische Verschiebung. Das Spektrum setzt sich also wie das HSQC-Spektrum prinzipiell aus einem 1H-NMR- und einem breitbandentkoppelten 13C-(15N-...) NMR-Spektrum zusammen.
1H- und 13C-NMR-Spektren von Acetylsalicylsäure
Hinweis
Die Nummern an den einzelnen Atomen der Strukturformel beziehen sich im 1H-NMR-Spektrum auf die H-Atome, im 13C-NMR-Spektrum auf die C-Atome.

Abb.1
HMBC-Spektrum von Acetylsalicylsäure
Im Folgenden ist das HMBC-Spektrum der Acetylsalicylsäure zu sehen. Der Bereich der chemischen Verschiebung wurde so gewählt, dass alle Signale des 2D-Spektrums sichtbar sind. Das Signal des Lösungsmittels CDCl3 wurde entfernt. Im Spektrum sind viele Signale zu erkennen, da sowohl C-H-Kopplungen über drei Bindungen als teilweise auch über zwei und vier Bindungen sichtbar sind.

Abb.2
Zur besseren Anschaulichkeit ist im Folgenden ein Ausschnitt aus dem HMBC-Spektrum der Acetylsalicylsäure dargestellt. Die intensiven Signale sind Kopplungen über drei Bindungen, die schwächeren über zwei bzw. vier Bindungen.

Abb.3
Im folgenden Spektrenausschnitt ist das Signal vergrößert dargestellt, das im obersten HMBC-Spektrum ganz unten rechts erscheint. Hier ist nun deutlich zu erkennen, dass dieses Signal von der C-H-Kopplung (über zwei Bindungen) des Protons der Methyl-Gruppe mit dem C-Atom 8 stammt. Eine (auch unwahrscheinliche) Kopplung mit C-Atom 7 kann ausgeschlossen werden.

Abb.4

Das NOESY (Nuclear Overhauser Enhancement SpectroscopY)-Experiment

Der Unterschied des NOESY-Experimentes im Vergleich mit den anderen hier erläuterten 2D-Verfahren (COSY, HSQC, HMBC) besteht darin, dass hier keine Beziehungen zwischen Kernen, die über skalare Spin-Spin-Kopplungen, d.h. über Bindungen, miteinander in Wechselwirkung treten, sichtbar gemacht werden, sondern Wechselwirkungen zwischen koppelnden Kerndipolen, die direkt über den Raum übertragen werden.
Dieser Magnetisierungstransfer über den Raum erfolgt über den Kern-Overhauser-Effekt.
Am häufigsten wird das homonukleare H-H-NOESY-Experiment durchgeführt, um Beziehungen zwischen Protonen (über den Raum) aufzudecken. Vorteilhaft ist die Aufnahme eines NOESY-Spektrums, wenn Beziehungen zwischen Protonen vermutet werden, die zwar über viele Bindungen voneinander getrennt (keine Signale im COSY-Spektrum), aber sich räumlich sehr nahe sind.

NOESY-Impulsfolge

Die HMBC-Impulsfolge besteht aus mehreren 90° - Impulsen und zusätzlichen gepulsten Gradientenfeldern.
Es ist darauf hinzuweisen, dass die Aufnahme eines NOESY-Spektrums mehrere Stunden in Anspruch nimmt (4,5 für das unten dargestellte Spektrum der Acetylsalicylsäure), wogegen die Aufnahmezeit von COSY-, HSQC- bzw. HMBC-Spektren meist zwischen 15 und 1 liegt.

Das NOESY-Spektrum

Im H,H-NOESY-Spektrum sind analog dem H,H-COSY-Spektrum auf beiden Achsen die 1H-chemischen Verschiebungen aufgetragen; prinzipiell sind auf beiden Achsen die 1H-NMR-Spektren zu sehen. Es ergibt sich also ein zur Diagonalen symmetrisches Diagramm. Das Spektrum beinhaltet wieder Diagonal- und Kreuzsignale.
1H-NMR-Spektrum von Acetylsalicylsäure

Abb.1
NOESY-Spektrum von Acetylsalicylsäure
Im Folgenden ist das NOESY-Spektrum der Acetylsalicylsäure zu sehen. Der Bereich der chemischen Verschiebung wurde so gewählt, dass alle Signale des 2D-Spektrums sichtbar sind.
Am interessantesten ist das Kreuzsignal bei 2,4 ppm/7,1 ppm, das die räumliche Nähe und somit die Wechselwirkungen über den Raum zwischen den Protonen 9 und 2 veranschaulicht. Weiterhin erscheinen die Signale, die auch im H,H-COSY-Spektrum zu sehen sind (die meist über drei Bindungen koppelnden Protonen sind sich auch räumlich nahe, so dass Signale im NOESY-Spektrum erscheinen).

Abb.2
Zur besseren Anschaulichkeit ist im Folgenden ein Ausschnitt aus dem NOESY-Spektrum der Acetylsalicylsäure dargestellt.

Abb.3
 
 
  Iran, Kermanshah, Kambadn
 
https://theotheriran.files.wordpress.com/2014/11/kermanshah-iran-kermanshah-kambadn-in-autumn-01.jpg?w=413&h=287&crop=1


////////////

NMR SPECTROSCOPY

Rico positive Umm alkaloid
1 H NMR  

1 it can be seen that from the H NMR, in the compound in the number of protons (integral value) and is dependent on the electronic state chemical shift (ppm) and, dependent on the number of adjacent proton coupling there is. To make a structural analysis, first, one look at the H NMR, where the chemical shift of some, there are any number of protons, and then determines whether you are what coupling (binding constant). Introduction coupling for. Proton of the molecule, as shown above


geminal and vicinal when magnetically non-equivalent proton is present in the position, it makes the coupling (division). Proton each other that the coupling together, the samecoupling constant ( J value) has a (crack width), sp 3 in the coupling of the geminal proton each other is attached to the hybridized carbon is 10 Hz position, vicinal proton each other For, it has a value that depends on the dihedral angle of the two protons as shown in the figure below. When the dihedral angle is close to 0 and 180 ° takes a large value, you can see that taking a small value when it is close to 90 °. 


Here an example of protons that are coupled. 


The figure above shows the picture of a case where there proton is a total of two geminal and vicinal proton coupling. ①: a state in which nothing has been coupling. ( s: singlet ) ②: state in which the coupling between one proton coupling constant a. ( D: doublet ) ③: ② state proton is another proton coupling in a more binding constant a of. ( dd: double doublet )     or ① state proton is coupled magnetically equivalent to two protons. ( t: Triplet ) ④: ② state proton is another protons and coupling in the near value (b) to further coupling constant a of. ( dd )     (slightly overlapping the center of the mountain, become larger than the outside of the mountain.) ⑤: ② state proton is another protons and coupling with significantly different value (c) the further coupling constant a of. ( dd ) (the height of the peak of 1: 1: 1: to 1) above diagram depicts the picture of a case where there proton is coupled with a total of three of geminal and vicinal proton. ⑥: ③ state proton is another proton coupling in a more binding constant a of. ( ddd: double double doublet )     or ① state proton is coupled magnetically equivalent to three protons. ( Q: Quartet ) (height of the peak is approximately 1: 3: 3: become 1)⑦: ③ state proton is another proton coupling further in coupling constant a smaller value (d) of. ( ddd ) ⑧: ③ state proton is another protons and coupling with a very large value (e) than further coupling constant a of. ( ddd ) then chemical shift for. The above figure, proton in a variety of environments can be taken, it shows the approximate chemical shift values. Proton bound to a benzene ring or a double bond takes a value of 6 ~ 8 ppm, methine present in the oxygen base of the ester, methylene, you can see that it is 4 ~ 5 ppm. Moreover, methine nitrogen atom is bonded to an oxygen atom, a methylene is 2.6 ~ 4.1 ppm, a hydrocarbon that does not bind to their heteroatom takes the value of 0.8 ~ 2.2 ppm. In addition, the integral value for (number of protons).


In the figure (1) to (5) all is 1 pieces of protons, and chemical shift, it is shown the case where the coupling is different. 
As you can see, even in the same one piece of the proton, we can see that the height of the peak by way of coupling is different. 
Basically, the more to increase the coupling, but peak height tend to be low, the integral value of each proton (area) does not change. 
If the peak height differ greatly even though it has already been a coupling similar, consider the number of protons is different. Well, there is a method of determining the chemical shift, which is one of the center of gravity of the proton is may be obtained a. Singlet: The value of the apex of the peak, doublet: the average value of the vertices of the two peaks triplet: The value of the apex of the peak of the middle quartet: the average value of the apex of the peak of the both ends or ... asked how would each person? By the way, the case of the above figure, (1) In the case of: There is one proton to 2.01 ppm, coupling s (singlet). (2) In the case of: located in one of the protons is 5.42 ppm, coupling d (doublet), coupling constant (J) is          (5.423-5.410) × 800 = 10.4 from 10.4 Hz. (3) In the case of: There is one proton to 3.40, coupling dd ​​(double doublet), coupling constant (J) is          (3.409-3.393) ÷ 2 × 800 = 6.4 than 6.4, 6.4 Hz. (4) In the case of: Yes to the 6.32 ppm 1 single proton, the coupling dd ​​(double doublet), coupling constant (J) is          (6.339-6.318) × 800 = 16.8 than one is 16.8 Hz. The other,          (6.339-6.330) × 800 = 7.2 than 7.2 Hz. In the case of (5): There is one proton to 1.55 ppm, coupling ddd (double double doublet), coupling constant (J) is          (1.563-1.551) ÷ 2 × 800 = 4.8 than 4.8, 4.8 Hz. The other,         (1.563-1.560) × 800 = 2.4 than 2.4 Hz. And it will decipher. Chemical shifts, rounded to two decimal places, on the other hand, the coupling constant is good to round off the second decimal place. ppm of the display 1 when calculating the binding constants from the H NMR should multiplied by the resonant frequency of the device to the difference between the peak apex. In the case of the figure above, it has 800 is used for the calculation formula because using NMR of 800 MHz. Moreover, when put together as data, if the (1), 2.01 (1H, s) In the case of (5), 1.55 (1H, ddd, 4.8, 4.8, 2.4) and will be referred.


13 C NMR

13 it can be seen from C NMR is the number of carbon atoms in the compound is dependent on the electronic state chemical shift (ppm) it is. 
All of the signal is a singlet, you do not need to seek the binding constant. If a large number of protons attached to carbon atoms, or an easily measured, there is a tendency that the height of the signal is high.Chemical shift is good when rounded to 2 decimal places.

From HMQC, C at a distance of Ha and 1 Bond 1 it will give correlation with.
Correlation shown in red, the carbon atoms of 61.9 ppm, represents that the bond is 2.74 and 2.84 ppm proton. 
Moreover, the correlation shown in blue, to a carbon atom of 41.3 ppm, represents that the bond is 2.25 and 2.38 ppm proton. 
Area shown in green, will not overlap a lot of correlation. Analysis give up please. It may be able to be analyzed by other means.
Ha If you pay attention to,
1 H 1 from the H COSY, Ha and Hb, c, obtained correlation with d. 
(Correlation between protons at a distance of 2, 3 bond from Ha) chart While are separated by a triangular red and blue, two regions are symmetrical, that is sufficient to analyze all either one of a pair It will be. For example, correlation and shown in light blue, both the correlation shown in purple, because it represents the correlation of 2.25 ppm and 2.38 ppm proton, and decrypt both, you will duplication of effort. Correlation shown in yellow shows the correlation of 2.56 ppm protons and 1.92 ppm proton. In addition, from the correlation shown in green, of 2.56 ppm proton further shows that there is a correlation with the 2.68 ppm proton.


From HMBC, C is a distance from Ha to 3 Bond 1 , C 2 , C 3 , C 5 , C 6 and the correlation is obtained with.
Correlation shown in red, shows the carbon correlation of 2.56 ppm protons and 39.9 ppm. In addition, the correlation shown in blue, of 2.56 ppm proton, shows that there is a correlation with carbon of 56.1 ppm. Green, correlations shown in purple represents that there is a correlation of two protons 3.00 and 3.06 ppm for the carbon of 52.8 ppm. On the other hand, the correlation shown in yellow shows the correlation between 10.0 ppm of carbon, but also try the attribution of the protons by tracing the correlation, I can not find proton. This correlation is observed in HMQC (1bond), in HMBC, because there is a feature that causes division. The 10.0 ppm proton location where there is a correlation with the carbon of the case will be 0.97 ppm is a midpoint of 0.85 and 1.08 ppm. Such a correlation, when, let's note Ayamarase the analysis. NOESY


From NOESY, Hb in the Ha and spatially close distance, c, d, e, I correlation with i is obtained. NOESY is mainly used when assigning a relative placement. COSY Similarly, blue and red of the area, but has become a nearly symmetrical, etc. If the correlation is poor, who both were firmly analysis would be better. Well, in the NOESY, as observed even COSY, associative even seen a correlation between close proton (2,3bond) It is not a wonder. Therefore, it can be said from the charts NOESY, information excluding the correlation seen in the chart of COSY is especially useful information. Yellow, green, correlations shown in purple shows a NOESY correlation in not observed COSY. With that collect such information in detail, you might be able to infer the relative placement.


Other
Or let's say even with the extended version of the COSY. 
From HOHAHA, Ha and Hb, c, d, e, f, g, h, I correlation is obtained with j. 
(If there are quaternary carbon in the carbon chain, the correlation between the above in the proton can not be obtained basically .Ha and Hk, l, m, n, o, etc..)