DR ANTHONY MELVIN CRASTO,WorldDrugTracker, helping millions, A 90 % paralysed man in action for you, I am suffering from transverse mylitis and bound to a wheel chair, With death on the horizon, nothing will not stop me except God................DR ANTHONY MELVIN CRASTO Ph.D ( ICT, Mumbai) , INDIA 25Yrs Exp. in the feld of Organic Chemistry,Working for GLENMARK GENERICS at Navi Mumbai, INDIA. Serving chemists around the world. Helping them with websites on Chemistry.Million hits on google, world acclamation from industry, academia, drug authorities for websites, blogs and educational contribution

Saturday 28 October 2017

Infrared (IR) spectroscopy

Infrared (IR) spectroscopy

In organic compounds, atoms are said to be bonded to each other through a σ bond when the two bonded atoms are held together by mutual attraction for the shared electron pair that lies between them. The two atoms do not remain static at a fixed distance from one another, however. They are free to vibrate back and forth about an average separation distance known as the average bond length. These movements are termed stretching vibrations. In addition, the bond axis (defined as the line directly joining two bonded atoms) of one bond may rock back and forth within the plane it shares with another bond or bend back and forth outside that plane. These movements are called bending vibrations. Both stretching and bending vibrations represent different energy levels of a molecule. These energy differences match the energies of wavelengths in the infrared region of the electromagnetic spectrum—i.e., those ranging from 2.5 to 15 micrometres (μm; 1 μm = 10−6m). An infrared spectrophotometer is an instrument that passes infrared light through an organic molecule and produces a spectrum that contains a plot of the amount of light transmitted on the vertical axis against the wavelength of infrared radiation on the horizontal axis. In infrared spectra the absorption peaks point downward because the vertical axis is the percent transmittance of the radiation through the sample. Absorption of radiation lowers the percent transmittance value. Since all bonds in an organic molecule interact with infrared radiation, IR spectra provide a great deal of structural data.
The stretching vibrations of strong carbon-hydrogen bonds cause the absorptions around 3.4 μm, with the sharp peak at 3.2 μm due to the hydrogen atom on the carbon-carbon double bond. The many bending vibrations of carbon-hydrogen bonds cause the complicated absorption pattern ranging from about 7 to 25 μm. This area of IR spectra is called the fingerprint region, because the absorption pattern is highly complex but unique to each organic structure. The stretching vibrations for both the carbon-carbon and carbon-oxygen double bonds are easily identified at 6.1 and 5.8 μm, respectively. Most of the functional groups have characteristic IR absorptions similar to those for carbon-oxygen and carbon-carbon double bonds. Infrared spectroscopy is therefore extremely useful for determining the types of functional groups present in organic molecules.

/////////////
https://www.britannica.com/science/chemical-compound/Spectroscopy-of-organic-compounds


WHAT IS AN INFRA-RED SPECTRUM?

This page describes what an infra-red spectrum is and how it arises from bond vibrations within organic molecules.

The background to infra-red spectroscopyHow an infra-red spectrum is produced
You probably know that visible light is made up of a continuous range of different electromagnetic frequencies - each frequency can be seen as a different colour. Infra-red radiation also consists of a continuous range of frequencies - it so happens that our eyes can't detect them.
If you shine a range of infra-red frequencies one at a time through a sample of an organic compound, you find that some frequencies get absorbed by the compound. A detector on the other side of the compound would show that some frequencies pass through the compound with almost no loss, but other frequencies are strongly absorbed.
How much of a particular frequency gets through the compound is measured as percentage transmittance.
A percentage transmittance of 100 would mean that all of that frequency passed straight through the compound without any being absorbed. In practice, that never happens - there is always some small loss, giving a transmittance of perhaps 95% as the best you can achieve.
A transmittance of only 5% would mean that nearly all of that particular frequency is absorbed by the compound. A very high absorption of this sort tells you important things about the bonds in the compound.

What an infra-red spectrum looks like
A graph is produced showing how the percentage transmittance varies with the frequency of the infra-red radiation.


Note:  The infra-red spectra on this page have been produced from graphs taken from the Spectral Data Base System for Organic Compounds (SDBS) at the National Institute of Materials and Chemical Research in Japan.
It is possible that small errors may have been introduced during the process of converting them for use on this site, but these won't affect the argument in any way.


Notice that an unusual measure of frequency is used on the horizontal axis. Wavenumber is defined like this:
Don't worry about this - just accept it!
Similarly, don't worry about the change of scale half-way across the horizontal axis. You will find infra-red spectra where the scale is consistent all the way across, infra-red spectra where the scale changes at around 2000 cm-1, and very occasionally where the scale changes again at around 1000 cm-1.
As you will see when we look at how to interpret infra-red spectra, this doesn't cause any problems - you simply need to be careful reading the horizontal scale.

What causes some frequencies to be absorbed?
Each frequency of light (including infra-red) has a certain energy. If a particular frequency is being absorbed as it passes through the compound being investigated, it must mean that its energy is being transferred to the compound.
Energies in infra-red radiation correspond to the energies involved in bond vibrations.
Bond stretching
In covalent bonds, atoms aren't joined by rigid links - the two atoms are held together because both nuclei are attracted to the same pair of electrons. The two nuclei can vibrate backwards and forwards - towards and away from each other - around an average position.
The diagram shows the stretching that happens in a carbon-oxygen single bond. There will, of course, be other atoms attached to both the carbon and the oxygen. For example, it could be the carbon-oxygen bond in methanol, CH3OH.
The energy involved in this vibration depends on things like the length of the bond and the mass of the atoms at either end. That means that each different bond will vibrate in a different way, involving different amounts of energy.
Bonds are vibrating all the time, but if you shine exactly the right amount of energy on a bond, you can kick it into a higher state of vibration. The amount of energy it needs to do this will vary from bond to bond, and so each different bond will absorb a different frequency (and hence energy) of infra-red radiation.
Bond bending
As well as stretching, bonds can also bend. The diagram shows the bending of the bonds in a water molecule. The effect of this, of course, is that the bond angle between the two hydrogen-oxygen bonds fluctuates slightly around its average value. Imagine a lab model of a water molecule where the atoms are joined together with springs. These bending vibrations are what you would see if you shook the model gently.
Again, bonds will be vibrating like this all the time and, again, if you shine exactly the right amount of energy on the bond, you can kick it into a higher state of vibration. Since the energies involved with the bending will be different for each kind of bond, each different bond will absorb a different frequency of infra-red radiation in order to make this jump from one state to a higher one.

Tying all this together
Look again at the infra-red spectrum of propan-1-ol, CH3CH2CH2OH:
In the diagram, three sample absorptions are picked out to show you the bond vibrations which produced them. Notice that bond stretching and bending produce different troughs in the spectrum.

INTERPRETING AN INFRA-RED SPECTRUM

This page explains how to use an infra-red spectrum to identify the presence of a few simple bonds in organic compounds.


The infra-red spectrum for a simple carboxylic acidEthanoic acid
Ethanoic acid has the structure:
You will see that it contains the following bonds:
carbon-oxygen double, C=O
carbon-oxygen single, C-O
oxygen-hydrogen, O-H
carbon-hydrogen, C-H
carbon-carbon single, C-C
The carbon-carbon bond has absorptions which occur over a wide range of wavenumbers in the fingerprint region - that makes it very difficult to pick out on an infra-red spectrum.
The carbon-oxygen single bond also has an absorbtion in the fingerprint region, varying between 1000 and 1300 cm-1depending on the molecule it is in. You have to be very wary about picking out a particular trough as being due to a C-O bond.


The other bonds in ethanoic acid have easily recognised absorptions outside the fingerprint region.
The C-H bond (where the hydrogen is attached to a carbon which is singly-bonded to everything else) absorbs somewhere in the range from 2853 - 2962 cm-1. Because that bond is present in most organic compounds, that's not terribly useful! What it means is that you can ignore a trough just under 3000 cm-1, because that is probably just due to C-H bonds.
The carbon-oxygen double bond, C=O, is one of the really useful absorptions, found in the range 1680 - 1750 cm-1. Its position varies slightly depending on what sort of compound it is in.
The other really useful bond is the O-H bond. This absorbs differently depending on its environment. It is easily recognised in an acid because it produces a very broad trough in the range 2500 - 3300 


The infra-red spectrum for ethanoic acid looks like this:
The possible absorption due to the C-O single bond is queried because it lies in the fingerprint region. You couldn't be sure that this trough wasn't caused by something else.


The infra-red spectrum for an alcoholEthanol
The O-H bond in an alcohol absorbs at a higher wavenumber than it does in an acid - somewhere between 3230 - 3550 cm-1. In fact this absorption would be at a higher number still if the alcohol isn't hydrogen bonded - for example, in the gas state. All the infra-red spectra on this page are from liquids - so that possibility will never apply.
Notice the absorption due to the C-H bonds just under 3000 cm-1, and also the troughs between 1000 and 1100 cm-1 - one of which will be due to the C-O bond.

The infra-red spectrum for an esterEthyl ethanoate
This time the O-H absorption is missing completely. Don't confuse it with the C-H trough fractionally less than 3000 cm-1. The presence of the C=O double bond is seen at about 1740 cm-1.
The C-O single bond is the absorption at about 1240 cm-1. Whether or not you could pick that out would depend on the detail given by the table of data which you get in your exam, because C-O single bonds vary anywhere between 1000 and 1300 cm-1 depending on what sort of compound they are in. Some tables of data fine it down, so that they will tell you that an absorption from 1230 - 1250 is the C-O bond in an ethanoate.

The infra-red spectrum for a ketonePropanone
You will find that this is very similar to the infra-red spectrum for ethyl ethanoate, an ester. Again, there is no trough due to the O-H bond, and again there is a marked absorption at about 1700 cm-1 due to the C=O.
Confusingly, there are also absorptions which look as if they might be due to C-O single bonds - which, of course, aren't present in propanone. This reinforces the care you have to take in trying to identify any absorptions in the fingerprint region.
Aldehydes will have similar infra-red spectra to ketones.

The infra-red spectrum for a hydroxy-acid2-hydroxypropanoic acid (lactic acid)
This is interesting because it contains two different sorts of O-H bond - the one in the acid and the simple "alcohol" type in the chain attached to the -COOH group.
The O-H bond in the acid group absorbs between 2500 and 3300, the one in the chain between 3230 and 3550 cm-1. Taken together, that gives this immense trough covering the whole range from 2500 to 3550 cm-1. Lost in that trough as well will be absorptions due to the C-H bonds.
Notice also the presence of the strong C=O absorption at about 1730 cm-1.

The infra-red spectrum for a primary amine1-aminobutane
Primary amines contain the -NH2 group, and so have N-H bonds. These absorb somewhere between 3100 and 3500 cm-1. That double trough (typical of primary amines) can be seen clearly on the spectrum to the left of the C-H absorptions.
THE FINGERPRINT REGION OF AN INFRA-RED SPECTRUM

This page explains what the fingerprint region of an infra-red spectrum is, and how it can be used to identify an organic molecule.


What is the fingerprint region
This is a typical infra-red spectrum:


Each trough is caused because energy is being absorbed from that particular frequency of infra-red radiation to excite bonds in the molecule to a higher state of vibration - either stretching or bending.
Some of the troughs are easily used to identify particular bonds in a molecule. For example, the big trough at the left-hand side of the spectrum is used to identify the presence of an oxygen-hydrogen bond in an -OH group.


The region to the right-hand side of the diagram (from about 1500 to 500 cm-1) usually contains a very complicated series of absorptions. These are mainly due to all manner of bending vibrations within the molecule. This is called the fingerprint region.
It is much more difficult to pick out individual bonds in this region than it is in the "cleaner" region at higher wavenumbers. The importance of the fingerprint region is that each different compound produces a different pattern of troughs in this part of the spectrum.

Using the fingerprint region
Compare the infra-red spectra of propan-1-ol and propan-2-ol. Both compounds contain exactly the same bonds. Both compounds have very similar troughs in the area around 3000 cm-1 - but compare them in the fingerprint region between 1500 and 500 cm-1.
The pattern in the fingerprint region is completely different and could therefore be used to identify the compound.
So . . . to positively identify an unknown compound, use its infra-red spectrum to identify what sort of compound it is by looking for specific bond absorptions. That might tell you, for example, that you had an alcohol because it contained an -OH group.
You would then compare the fingerprint region of its infra-red spectrum with known spectra measured under exactly the same conditions to find out which alcohol (or whatever) you had.

Friday 27 October 2017

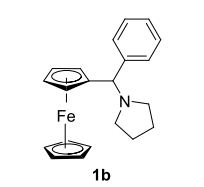
1-(Ferrocenyl(phenyl)methyl)pyrrolidine

str1

1-(Ferrocenyl(phenyl)methyl)pyrrolidine (1b) was obtained (2.14 g, 62% yield) as an orange solid. m.p. 100-102 oC;
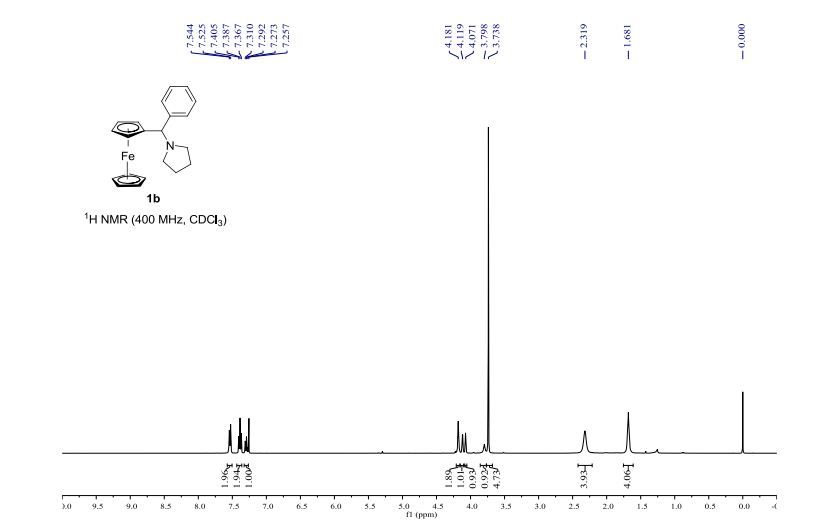
1H NMR (400 MHz, CDCl3) δ 7.53 (d, J = 7.6 Hz, 2H), 7.38 (t, J = 7.6 Hz, 2H), 7.29 (t, J = 7.6 Hz, 1H), 4.18 (s, 2H), 4.12 (s, 1H), 4.07 (s, 1H), 3.80 (s, 1H), 3.74 (s, 5H), 2.32 (s, 4H), 1.68 (s, 4H);
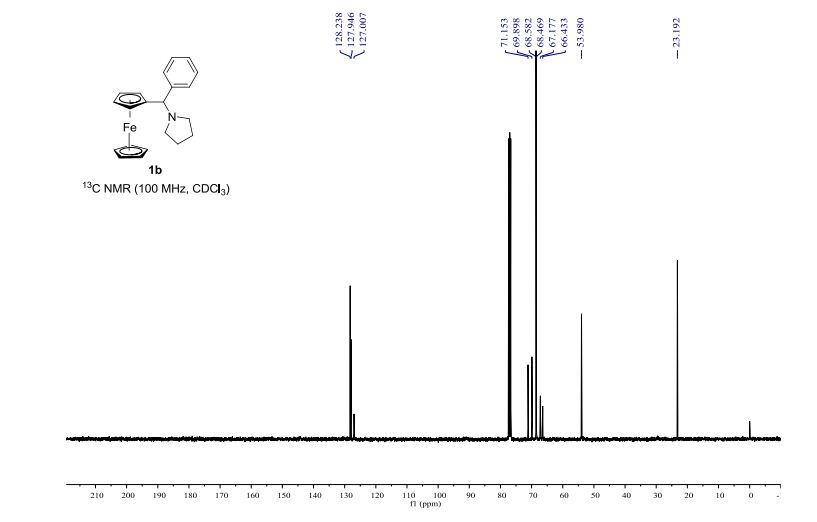
13C NMR (100 MHz, CDCl3) δ 128.2, 127.9, 127.0, 71.2, 69.9, 68.6, 68.5, 67.2, 66.4, 54.0, 23.2;
HRMS (ESI) calcd for C21H24FeN+ (M + H)+ 346.1253, found 346.1247.

////////////

Wednesday 25 October 2017

Cross dehydrogenative coupling of N-aryltetrahydroisoquinolines (sp3 C-H) with indoles (sp2 C-H) using a heterogeneous mesoporous manganese oxide catalyst


Cross dehydrogenative coupling of N-aryltetrahydroisoquinolines (sp3 C-H) with indoles (sp2 C-H) using a heterogeneous mesoporous manganese oxide catalyst
Green Chem., 2017, Advance Article
DOI: 10.1039/C7GC01919J, Communication
B. Dutta, V. Sharma, N. Sassu, Y. Dang, C. Weerakkody, J. Macharia, R. Miao, A. R. Howell, S. L. Suib
We disclose a novel, heterogeneous catalytic approach for selective coupling of C1 of N-aryltetrahydroisoquinolines with C3 of indoles in the presence of mesoporous manganese oxides.

Cross dehydrogenative coupling of N-aryltetrahydroisoquinolines (sp3 C–H) with indoles (sp2 C–H) using a heterogeneous mesoporous manganese oxide catalyst

Biswanath Dutta

Ph.D Candidate
Chemistry

B.Sc. Chemistry, University of Calcutta, India, 2011
M.S. Chemistry, IIT Bombay, India, 2013
Group Member Since 2013
Research Area: Material synthesis, Catalysis

Image result for University of Connecticut S. L. Suib

Steven Suib

Professor
Emailsteven.suib@uconn.edu
Phone(860) 486-2797
Fax(860) 486-2981
Mailing AddressUniversity of Connecticut
Department of Chemistry
55 N. Eagleville Rd
Storrs, CT 06269
Office LocationCHEM A-313

Abstract

We disclose a novel, heterogeneous catalytic approach for selective coupling of C1 of N-aryltetrahydroisoquinolines with C3 of indoles in the presence of mesoporous manganese oxides. Our work involves a detailed mechanistic investigation of the reaction on the catalyst surface, backed by DFT computational studies, to understand the superior catalytic activity of manganese oxides.

////////////////////

Tuesday 24 October 2017

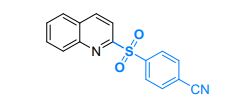
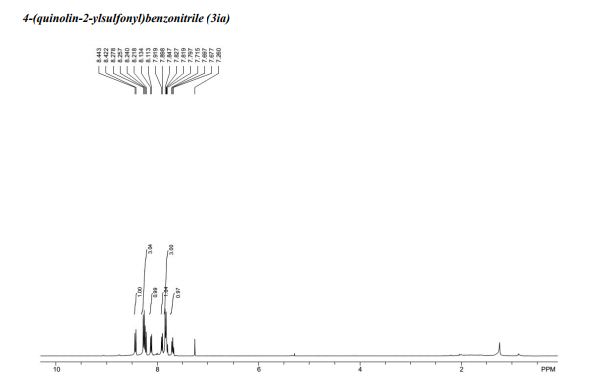
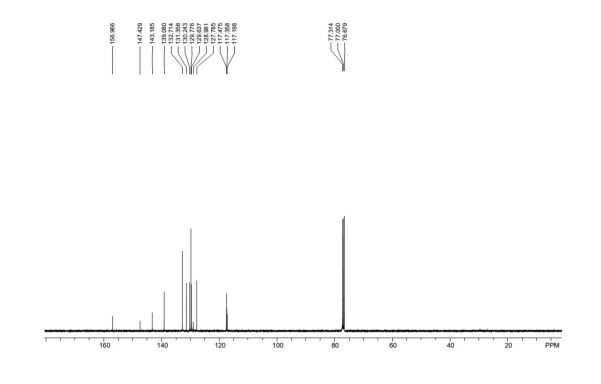
4-(quinolin-2-ylsulfonyl)benzonitrile


str1

4-(quinolin-2-ylsulfonyl)benzonitrile (3ia)5
1H NMR (400 MHz, CDCl3):  = 8.43 (d, J = 8.4 Hz, 1 H), 8.28 – 8.22 (m, 3 H), 8.12 (d, J = 8.4 Hz, 1 H), 7.91 (d, J = 8.4 Hz, 1 H), 7.85 – 7.80 (m, 3 H), 7.70 (t, J = 8.0 Hz, 1 H); 13C NMR (100 MHz, CDCl3): δ = 157.0, 147.4, 143.2, 139.1, 132.7, 131.4, 130.2, 129.8, 129.6, 129.0, 127.8, 117.5, 117.4, 117.2.

Base-free, ultrasound accelerated one-pot synthesis of 2-sulfonylquinolines on water


Abstract

Without employing any base and organic solvent, an economical, practical and eco-friendly protocol has been developed for the one-pot synthesis of various functionalized 2-sulfonylquinolines from easily accessible starting materials on water under open-air conditions. Compared with conventional heating conditions, the use of ultrasound techniques not only improves the reaction efficiency and enhances the reaction rate but also minimizes the side reactions. This process has a broad substrate scope, mild reaction conditions, good yields, excellent chemo- and regioselectivity, operational simplicity, ease of scale-up and high energy efficiency. In addition, the process is remarkably greener than previous routes with an atom economy of 70.7%, E-factor of 1.17 and eco-scale score of 71.

Friday 20 October 2017

Ethyl acetate

Ethyl acetate example:

EthylacetateH

Predictions:
PositionIntegrationSplittingChemical Shift
12Three nearest neighbours that are equivalent – quartetSingle bond to oxygen – deshielded
23Two nearest neighbours that are equivalent – tripletSaturated alkyl group far from ester group – shielded
2′3No nearest neighbours – singletAdjacent to the carbon of a carbonyl – slightly deshielded

Ethyl crotonate

ehtylcrotonateblog1


Homonuclear J-resolved Spectroscopy (JRES): An Educational Tool


Many undergraduates that have been introduced to NMR understand the concepts of chemical shift and coupling, however struggle when presented with a real 1H NMR spectrum. For a novice at interpreting proton NMR spectra, it can be difficult to distinguish between separate resonances and multiplets belonging to the same resonance.
‘JRES’ is a 2D homonuclear experiment that produces a J-resolved spectrum, i.e. the chemical shift along one axis (f2) and the proton-proton coupling along the other axis (f1). Essentially, the projection along f2 is a decoupled proton spectrum, which greatly simplifies the spectrum and allows students to quickly identify the chemical shift and coupling pattern.
Comparison of the JRES spectrum with the 1D proton spectrum allows students to understand how proton-proton coupling affects the appearance of the spectrum and become more confident at distinguishing between multiplets and different resonances.


ehtylcrotonateblog2

In the 1D proton NMR spectrum there are a set of peaks around 5.5-6 ppm. It is not obvious to the beginner whether these are two separate resonances or a large doublet. In the JRES we can see that in fact the two resonances collapse into one peak in the f2 dimension and is split into a doublet in the f1 dimension, which means the peaks are one proton split into a doublet. From the 1D proton spectrum it is also difficult to determine whether the set of peaks between 6.3-7.2 ppm is one or multiple resonances, and what the splitting pattern is. This is resolved in the JRES spectrum where again all of the peaks collapse into one in the f2 dimension, so the set of peaks is due to one resonance. It can also be determined by JRES that it is split into a doublet of quartets, which is difficult to see in the 1D proton NMR spectrum.


NMR EXAMPLES

Image result for nmr education

  • Figure 1Proton NMR of 100% Methyl Acetate


Image result for nmr education

 2Proton NMR of 100% Methyl Propionate


Proton NMR of 100% Methyl Butyrate


///////////

1H NMR spectra of the C4H8O2 isomers

Image result for nmr education


Ethyl(1R,2S,3S,4S)-2-(furan-2-yl)-3-nitro-6-oxobicyclo[2.2.2]octane-1-carboxylate


Ethyl(1R,2S,3S,4S)-2-(furan-2-yl)-3-nitro-6-oxobicyclo[2.2.2]octane-1-carboxylate


Compound 7 Ethyl(1R,2S,3S,4S)-2-(furan-2-yl)-3-nitro-6-oxobicyclo[2.2.2]octane-1-carboxylate To a solution of CAT 10 (128 mg, 0.37 mmol) and the nitroolefin 9 (3.1 g, 22.3 mmol) in 10 mL anhydrous CH2Cl2 at room temperature was added enone 8 (1.8 g, 10.7 mmol). The resulting mixture was stirred at the same temperature until enone 8 is consumed as indicated by TLC. Then DBU (0.34 mL, 3.20 mmol) was added and the mixture was allowed to stir at ambient temperature until completion as indicated by TLC. The solution was concentrated in vacuo and purified by flash chromatography on silica gel (Hexane / EtOAc = 20 / 1) to give 7 (2 g, 61% yield) as a yellow solid. [α]D 23 28.0 (c = 1.0, CHCl3).

1H NMR (400 MHz, CDCl3): δ 7.29 (d, J = 0.8 Hz, 1H), 6.27 (dd, J = 2.0 Hz, J = 3.2 Hz, 1H), 6.14 (d, J = 4.0 Hz, 1H), 4.93 (m, 1H), 4.57 (d, J = 4.4 Hz, 1H), 4.11 (m, 2H), 3.04-3.02 (m, 1H), 2.80-2.75 (m, 1H), 2.60- 2.54 (m, 1H), 2.33-2.29 (m, 1H), 1.88-1.72 (m, 2H), 1.33-1.23 (m, 1H), 1.21 (t, J = 7.2 Hz, 3H).

13C NMR (100 MHz, CDCl3): δ 204.1, 168.7, 151.8, 142.5, 110.5, 108.1, 88.3, 61.3, 56.3, 42.0, 40.8, 33.7, 26.9, 19.2, 13.8.

IR (thin film): 3435, 3141, 3120, 2996, 2959, 1715, 1653, 1621, 1557, 1505, 1473, 1443, 1408, 1371, 1336, 1301, 1336, 1301, 1270, 1236, 1142, 1120, 1083, 1062, 1074, 1045, 1045, 1011, 996, 960, 930, 892, 884, 867, 803, 753, 628, 600, 508, 436 cm-1 .

LRMS (ESI): 308.0 (M+H)+ , 330.0 (M+Na)+ .

 HRMS (ESI): calcd for C15H18O6N (M+H) + : 308.1129. Found: 308.1130.

 Melting point: 117-118 oC.


Concise asymmetric total synthesis of (−)-patchouli alcohol


 Author affiliations

Abstract

The asymmetric total synthesis of (−)-patchouli alcohol was accomplished in a concise manner. Key reactions include a highly diastereo- and enantioselective formal organocatalytic [4 + 2] cycloaddition reaction, a radical denitration reaction, and an oxidative carboxylation reaction. The formal synthesis of norpatchoulenol was achieved as well.
Graphical abstract: Concise asymmetric total synthesis of (−)-patchouli alcohol


/////////

Thursday 19 October 2017

2-Methyl-3-tosyl-1,2,3,4-tetrahydroquinazoline

Image result for NMR IN COLOUR


Two-dimensional proton–proton NMR correlation spectrum of 2-methyl-3-tosyl-1,2,3,4-tetrahydroquinazoline in acetone-d6. A colour code was used to highlight the observed H–H couplings.


image file: c6ra20886j-s2.tif


Scheme 2 Pd-mediated hydrolysis of triethylamine in the presence of 2-tosylaminomethylaniline (HATs) to yield 2-methyl-3-tosyl-1,2,3,4-tetrahydroquinazoline and di(acetato)bis(diethylamine)palladium(II).

2-Methyl-3-tosyl-1,2,3,4-tetrahydroquinazoline

Yield = 12.3 mg (41%). 1H NMR (400 MHz, dmso-d6): δ/ppm 7.56 (d, J = 8.2 Hz, 2H, 2 × H-2′), 7.16 (d, J = 8.1 Hz, 2H, 2 × H-3′), 6.83 (m, 2H, H-5 + H-7), 6.46 (t, J = 7.1, 1H, H-6), 6.25 (d, J = 8.1 Hz, 1H, H-8), 6.09 (d, J = 3.4 Hz, 1H, NH), 5.22 (m, 1H, H-2), 4.54 (d, J = 17.2 Hz, 1H, CHH-4) and 4.36 (d, J = 17.2 Hz, 1H, CHH-4), 2.25 (s, 3H, CH3-4′) and 1.22 (d, 3H, J = 6.3 Hz, CH3-2). 1H NMR (250 MHz, CDCl3): δ/ppm 7.59 (d, J = 8.3 Hz, 2H, 2 × H-2′), 7.06 (d, J = 8.3 Hz, 2H, 2 × H-3′), 6.90 (t, 1H, H-7), 6.86 (d, 1H, H-5), 6.67 (dt, J = 7.5 and 1.1 Hz, 1H, H-6), 6.29 (d, J = 8.1 Hz, 1H, H-8), 5.36 (dq, J = 6.4 and 1.0 Hz, 1H, H-2), 4.70 (d, J = 17.4 Hz, 1H, CH2-4), 4.47 (d, J = 17.4 Hz, 1H, CH2-4), 2.29 (s, 3H, CH3) and 1.40 (d, J = 6.4 Hz, 3H, CH3). 13C NMR (62.5 MHz, CDCl3): δ/ppm 143.2 (C4′), 139.7 (C8a), 136.2 (C1′), 129.0 (2 × C3′), 127.6 (C5), 127.3 (2 × C2′), 126.4 (C7), 118.8 (C6), 116.9 (C4a), 116.4 (C8), 61.4 (CH), 41.8 (CH2), 21.5 (CH3) and 21.4 (CH3). IR (KBr, cm−1): 3387(s) ν(NH) cm−1, 1326(s) νas(SO2), 1158(vs) νs(SO2). MS (ESI) m/z = 325 (MNa+). HRMS calcd for C16H18N2NaO2S (MNa+): 325.0981; found, 325.0967. Elemental analysis (found): C 63.5, H 5.8, N 9.1; S, 10.5%. Calc. for C16H18N2O2S: C, 63.6; H, 6.0; N, 9.3; S, 10.6%.


http://pubs.rsc.org/en/content/articlehtml/2016/RA/C6RA20886J


//////////////

NMR PRESENTATION


NMR PRESENTATION


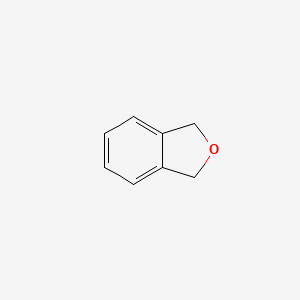
PHTHALAN


Phtalan

PHTHALAN


PHTHALAN.png
1H NMR PREDICT


13C NMR PREDICT


Phthalane is a bicyclic aromatic organic compound. It is also known as isocoumaran, or 1,3-dihydro-2-benzofuran. Derivatives are found in the drug Citalopram, and drug candidate Lu 10-171. It can be oxidised to phthalic acid.
Phthalane
Phthalan-2D-skeletal.png
Names
IUPAC name
1,3-dihydroisobenzofuran
Identifiers
3D model (JSmol)
ChemSpider
ECHA InfoCard100.007.106
EC Number207-815-2
PubChem CID
Properties
C8H8O
Molar mass120.148
Except where otherwise noted, data are given for materials in their standard state (at 25 °C [77 °F], 100 kPa).


////////////////

N-carboxymethyl indoline


N-carboxymethyl indoline 

2,3-dihydrobenzo[b][1,4]dioxine


2,3-dihydrobenzo[b][1,4]dioxine

////////